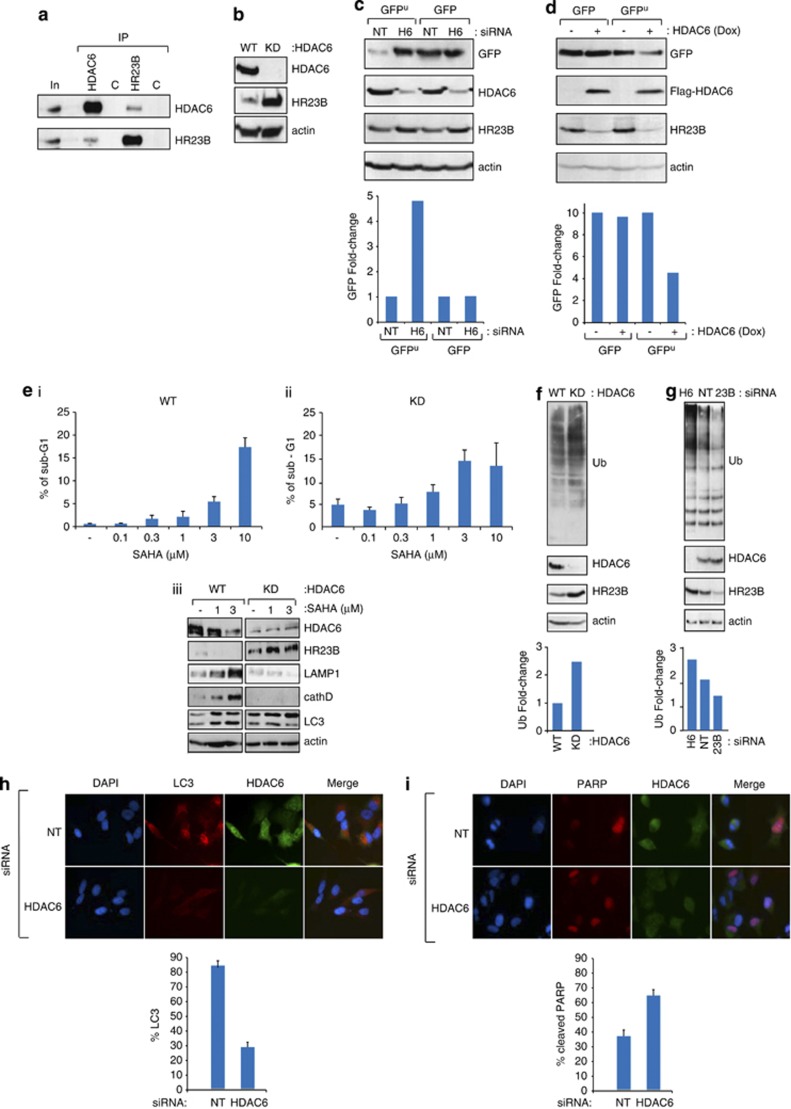
Figure 3.
Interplay between HDAC6 and HR23B. (a) Extracts prepared from U2OS cells were immunoprecipitated with anti-HR23B anti-HDAC6 or control (C) immunoglobulins, followed by immunoblotting with the indicated antibody. The levels of HR23B and HDAC6 are shown in the input (In), together with the control (C) immunoprecipitation. HR23B and HDAC6 are indicated. (b) Extracts prepared from WT or HDAC6 stable shRNA-expressing (KD) A549 cells were immunoblotted with the indicated antibodies. (c) U2OS cells were transfected with control (NT) or HDAC6 siRNA (50 nM) for 24 h, then transfected with GFP or GFPu for 48 h as indicated. Cell lysates were analysed as described. Levels of GFP, HR23B, HDAC6 and actin are shown. Quantification of the GFP signal is shown underneath. (d) U2OS cells stably expressing inducible ectopic Flag-HDAC6 were treated with doxycycline (+ and − 1 μg/ml) for 72 h, and transiently transfected with GFPu or GFP (100 ng) for 48 h as indicated. Cell lysates were analysed as described. Quantification of the GFP signal is shown underneath. (e) Either WT or HDAC6 stable shRNA-expressing (KD) A549 cells were treated with SAHA for 24 h as indicated and thereafter the level of sub-G1 (apoptotic) cells measured by flow cytometry (i and ii; n=3, error bars indicate S.E.M.). Extracts were prepared and immunoblotted with antibodies for LAMP1, cathepsin D and LC3 to assess the level of apoptosis and autophagy, in addition to HDAC6, HR23B and actin (iii). (f and g) Lysates from WT and HDAC6 stable shRNA-expressing (KD) cells (f), or WT cells treated with HDAC6, HR23B or NT siRNA for 48 h (g). Cell lysates were analysed by immunoblotting with anti-Ub for endogenous ubiquitination (f and g). Input levels of HDAC6, HR23B and actin are shown underneath. Quantification of the ubiquitin signal is presented in the graph. (h and i) U2OS cells were transfected with control (NT) or HDAC6 siRNA for 48 h, and then immunostained in (h) for LC3 (red) and HDAC6 (green), and in (i) for cleaved PARP (red) and HDAC6 (green). Merged images are shown for each (h and i). Quantification performed by counting 500 cells under NT or HDAC6 siRNA treatment conditions is shown underneath

