Figure 1.
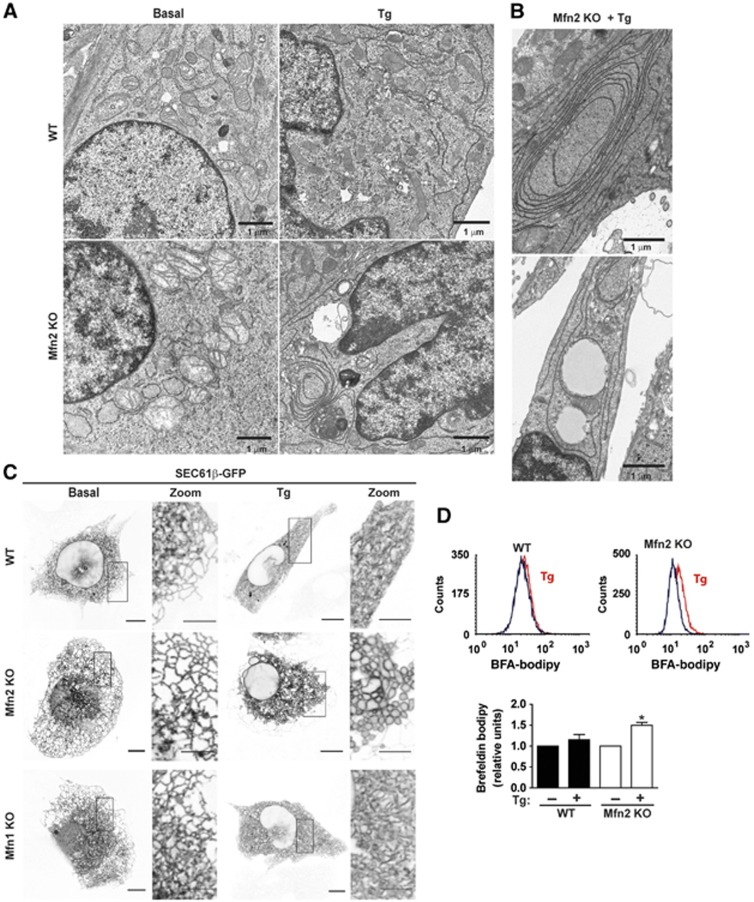
Mfn2 ablation promotes abnormal ER expansion during ER stress conditions. (A) WT or Mfn2 KO MEFs (Mfn2 KO cells) were treated with 1 μM Tg for 12 h and then processed for EM visualization of the ER morphology. Scale bar: 1 μm. (B) EM images of Tg-treated Mfn2 KO cells show accumulation of ER membrane stacking. Scale bar: 1 μm. (C) WT, Mfn2 KO or Mfn1 KO cells were transfected with the Sec61β-GFP plasmid and treated with 1 μM Tg for 24 h. Confocal microscopy images show ER vacuolization in Mfn2 KO cells treated with Tg. Scale bar: 10 μm. Insets show × 10 zoomed images. Scale bar: 5 μm. (D) WT and Mfn2 KO cells were treated with Tg 1 μM for 3 h and then incubated with brefeldin A-bodipy to stain ER and Golgi. Representative flow-cytometry histograms (upper panel). Mean fluorescence intensity was used to quantify ER expansion (n=5) (lower panel). Data are mean±s.e.m. *P<0.05 versus WT group.

