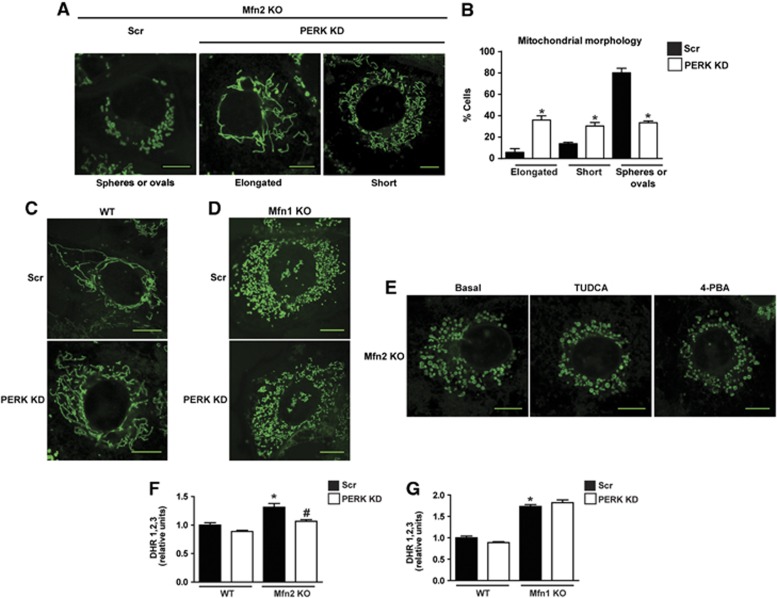
Figure 8.
PERK knockdown rescues mitochondrial morphology and excessive ROS production in Mfn2 KO cells. (A) Representative confocal images of mitochondrial morphology in scrambled (Scr) and PERK KD Mfn2 KO cells stained with MitoTracker Green. (B) Mitochondrial morphology quantification. Data are mean±s.e.m. (n=3; 100 cells were analyzed per experiment and group). *P<0.05 versus Scr group. (C, D) Representative confocal images of mitochondrial morphology in scrambled (Scr) and PERK KD WT cells (C) or scrambled (Scr) and PERK KD Mfn1 KO cells (D) stained with MitoTracker Green. (E) Representative confocal images of mitochondrial morphology in Mfn2 KO cells treated with 1 μM TUDCA or 10 mM 4-phenyl butyric acid for 6 h and stained with MitoTracker Green. (F) Flow-cytometry quantification of ROS levels in Scr and PERK KD WT and Mfn2 KO cells (G) or Scr and PERK KD WT and Mfn1 cells using DHR1,2,3. Data are mean±s.e.m. (n=4). *P<0.05 versus WT group, #P<0.05 versus Scr group. Scale bars: 10 μm.

