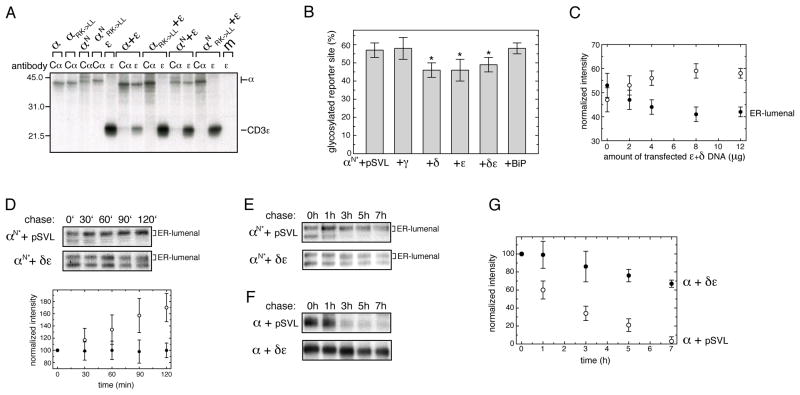
Figure 5. CD3δ and ε retain the α-chain in the ER membrane and stabilize it against degradation.
(A) The indicated α-chain constructs were co-expressed with the CD3ε chain and radiolabeled lysates were immunoprecipitated with antibodies to Cα or CD3ε. Mutations of the TM basic residues in the α-chain to Leu are indicated (RK->LL) (m: mock transfection).
(B) Quantification of the reporter site glycosylation species for αN* as a percent of the total amount of protein immunoprecipitated was performed by phosphorimager analysis. Data that were statistically significantly different from the αN* construct in the presence of empty pSVL vector are marked with an asterisk (n=7±SD, Student’s t test, p<0.005).
(C) The amount of C-terminal glycosylation for αN* in the presence of increasing amounts of CD3δ and ε was assessed. Two microgram of αN* were co-transfected with the indicated amounts of δ+ε DNA (equal amounts of both CD3 constructs were used). Closed circles denote the relative amount of αN* chains that are C-terminally glycosylated and completely ER-lumenal, and open circles the relative amount of αN* that is not C-terminally glycosylated (n=3±SD).
(D) Pulse-chase experiments were conducted over an interval of 2 h on cells co-expressing either αN* together with empty pSVL vector or with both CDδ and ε. The upper autoradiograph shows data for αN* in the presence of empty pSVL vector, the lower autoradiograph in the presence of CDδ and ε. Quantifications of the upper band, corresponding to the ER-lumenal species, are shown below the autoradiographs. Open circles are derived from αN*+pSVL and closed circles from αN*+CDδ and ε (n=6±SD). The signal present at t=0′ is arbitrarily set to 100 in both cases.
(E) Pulse-chase experiments to follow the ER import of αN* over time in the presence of either empty pSVL vector or a combination of CD3δ and ε. C-terminally glycosylated, ER-lumenal species are indicated.
(F) Pulse-chase experiments conducted on the wt α-chain expressed alone or in the presence of either empty pSVL vector or CD3δ and ε to assess its stability.
(G) Quantifications of the data shown in (F) (n=3±SD). Open circles show the degradation of α+pSVL, and closed circles indicate that of α when co-expressed with CDδ and ε. See also Figure S5.

