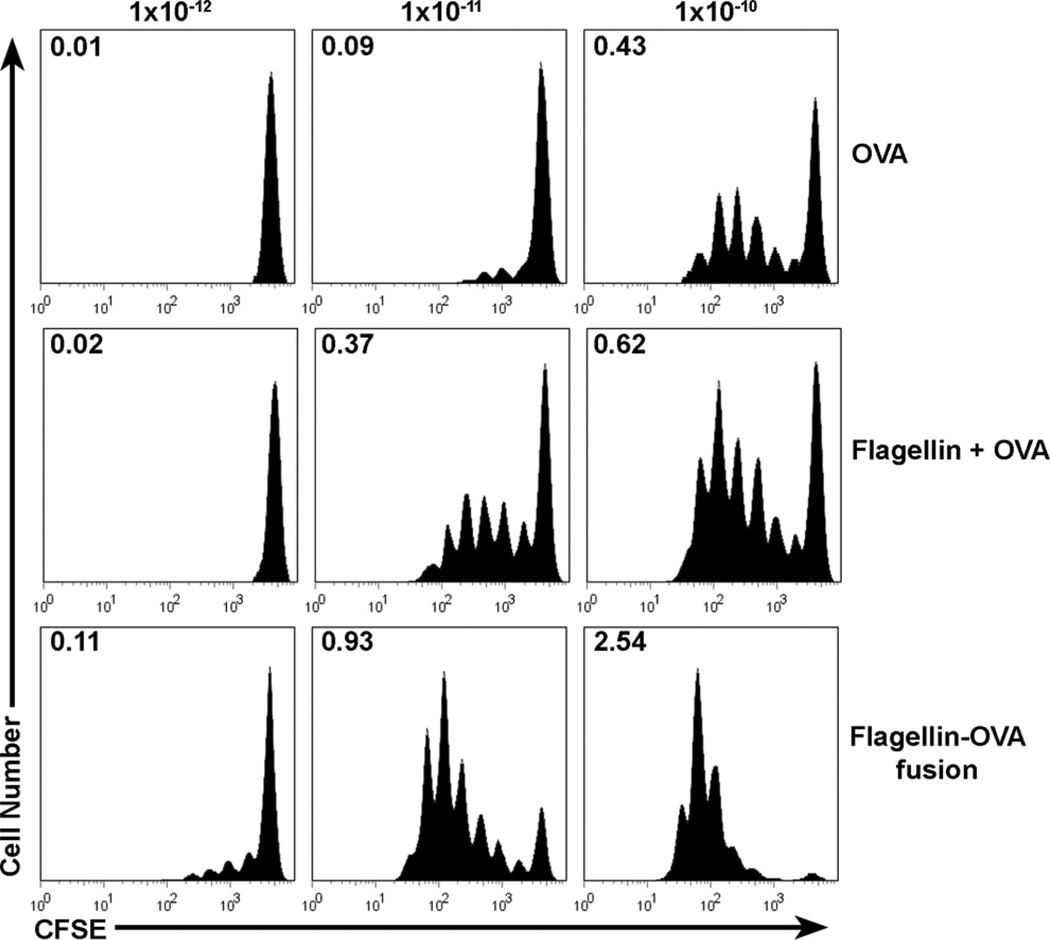
FIGURE 4.
In vivo T cell proliferation in response to immunization with OVA, flagellin plus OVA, or flagellin-OVA fusion protein. C57BL/6 mice were i.v. injected with 3 × 10⁶ CFSE-labeled, CD4+CD90.1+ OT-II T cells. Twenty-four hours later, mice were immunized i.m. with 1 × 10⁻¹², 1 × 10⁻¹¹, or 1 × 10⁻¹⁰ mol of OVA, flagellin and OVA, or flagellin-OVA fusion protein. Mice were sacrificed 3 days following immunization, and proliferation by the OT-II population in the draining, popliteal lymph node was compared based on CFSE dilution. Numbers indicate the division index, which is the average number of divisions that a cell present in the starting population has undergone. Histograms are gated on CD4+CD90.1+ cells. The data in this experiment were obtained from four mice per group. The experiment was repeated twice with similar results.

