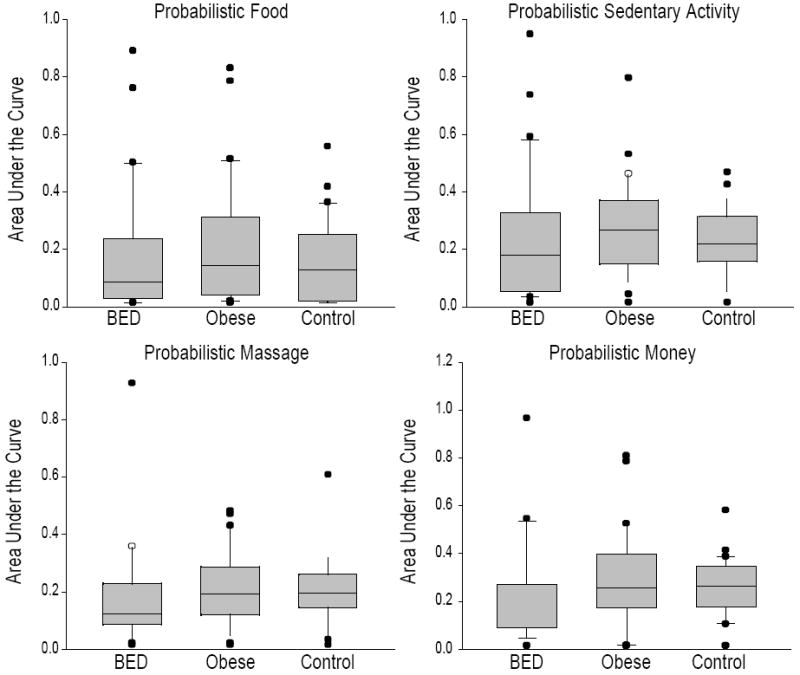
Figure 3.

Box plots of AuC values for the BED, obese, and control groups on the probability discounting tasks. Each panel presents the data for a different type of probabilistic reward. As in Figure 1, the bottom and top of each box represent the 25th and 75th percentiles, and the horizontal line within each box represents the group median. The vertical lines extending from the boxes represent the minimum and maximum values that are not outliers, and the solid circles represent outliers (i.e., values above the 90th percentile or below the 10th percentile).
