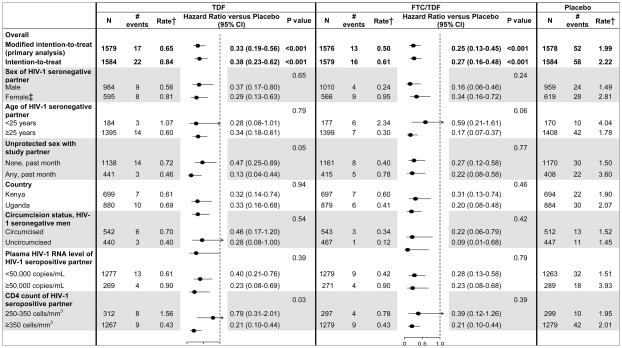
Figure 3. HIV-1 incidence by study arm, overall and among subgroups.*.
P values for the modified intention-to-treat and the intention-to-treat analyses apply to the hypothesis of any evidence of efficacy (i.e,. testing against a null hypothesis of 0%); P values for the other comparisons correspond to a test for significant interaction in the site-stratified Cox proportional hazards model.
*Subgroups defined by baseline characteristics. In the forest plots, dashed line indicates HR of 1.0 (0% efficacy for HIV-1 protection).
†Per 100 person-years
‡Of 45 HIV-1 infections in women, 5 (2 TDF, 0 FTC/TDF, 3 placebo) occurred in subjects who were not receiving study medication for >3 months due to pregnancy or breastfeeding.

