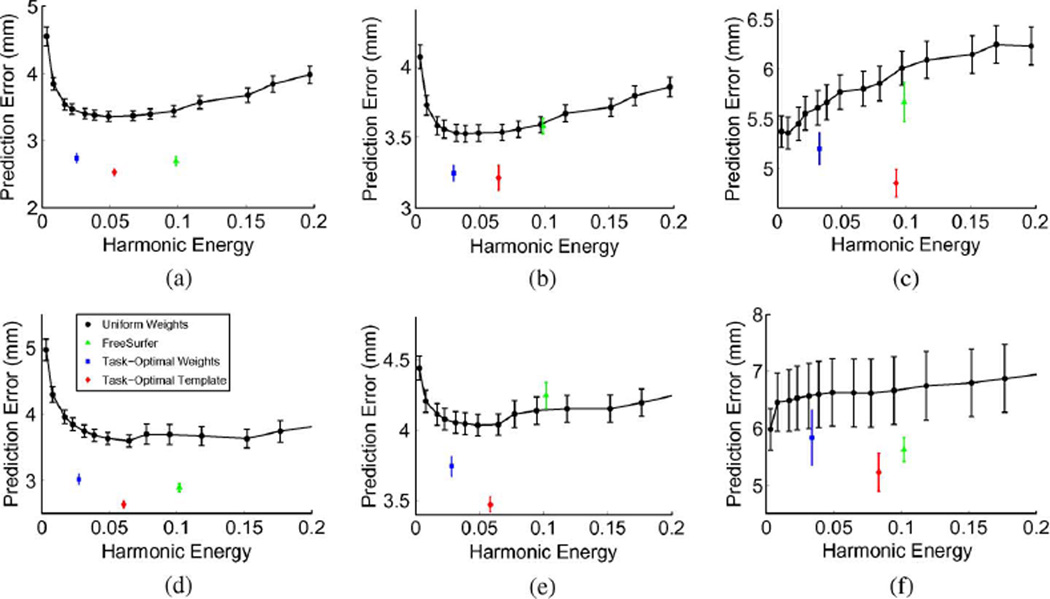
Fig. 6.
Mean Hausdorff distances over an entire range of harmonic energy for V1, V2, and BA2. First row corresponds to left hemisphere. Second row corresponds to right hemisphere. * indicates that task-optimal template is statistically significantly better than FreeSurfer. † indicates that task-optimal weights is statistically significantly better than FreeSurfer. Statistical threshold is set at 0.05, FDR corrected with respect to the 24 statistical tests performed in this section. FreeSurfer is not statistically better than either of the task-optimal methods in any of the Brodmann areas. (a) Left V1 *. (b) Left V2 *, †. (c) Left BA2 *, †. (d) Right V1 *. (e) Right V2 *, †. (f) Right BA2.

