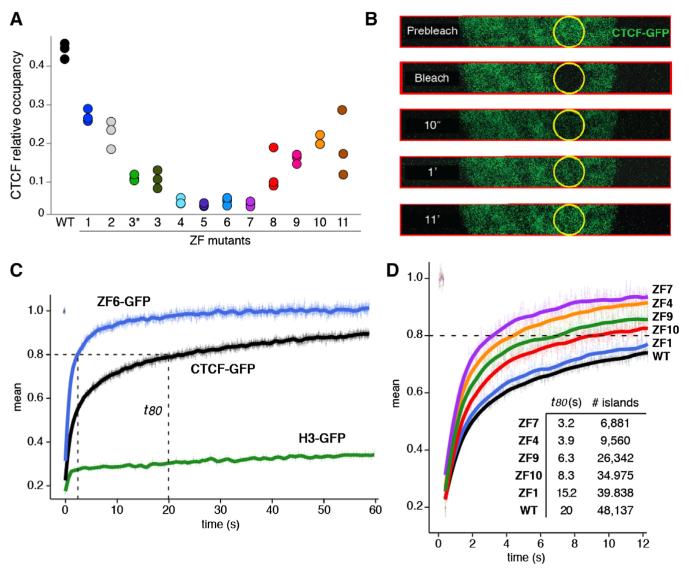
Figure 2. ZF Mutations Affect CTCF Binding and Chromatin Residence Time In Vivo.
(A) Relative CTCF occupancy (fraction of reads at binding sites) for the WT or ZF mutant CTCF. Presented are all three biological replicates for each sample.
(B) Nuclear dynamics of the WT or ZF mutant CTCF tagged with green fluorescent protein (GFP) as measured by fluorescent recovery after photobleaching (FRAP). CTCF constructs were transiently expressed in the 3134 mouse cell line. For fast data collection during FRAP, images were collected only in a strip encompassing the circular bleach spot area. Selected time points (t) are shown.
(C) Fluorescence recovery of CTCF-GFP, ZF6-GFP, and histone H3-GFP control following irreversible photobleaching. t80 represents the time (in seconds) when 80% of the original fluorescence at the bleached spot recovers. Data represent the mean values ± SEM, n = 15–30 cells.
(D) Comparison of the FRAP curves obtained with CTCF WT and ZF mutants. The total number of CTCF ChIP-seq peaks (from Figure 1E) and t80 values are provided as a table. Data represent the mean values ± SEM, n = 15–30 cells.

