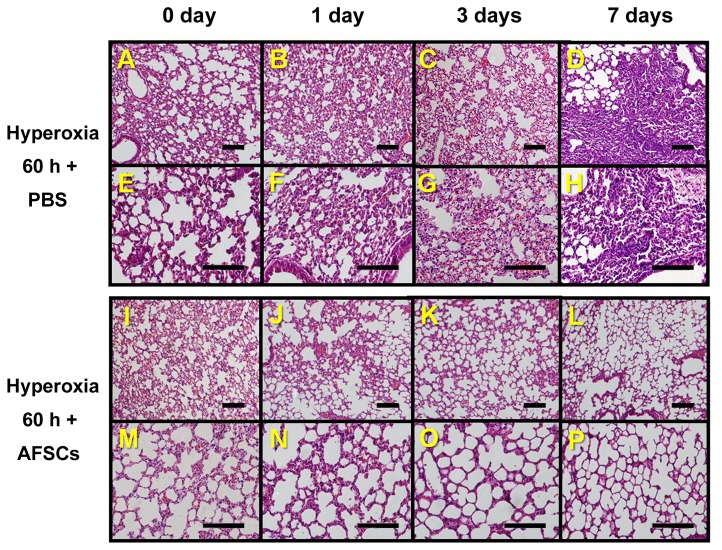
Figure 4. Histological comparisons of lung tissues from the hyperoxia-exposed control mice and the hyperoxia-exposed AFSCs-treated mice.
(A, B, C, D) Lung histology (H&E staining, 200x magnification) of mice exposed to hyperoxia for 60 h, shown at 0, 1, 3, and 7 days, respectively, after treatment with PBS. (E, F, G, H) The same groups as above shown at 400x magnification. (I, J, K, L) Histology (H&E staining, 200x magnification) of lung sections from animals exposed to hyperoxia for 60 h, shown at 0, 1, 3, and 7 days, respectively, after treatment with AFSCs. (M, N, O, P) The same groups as shown in I, J, K, and L shown at 400x magnification. Scale bar =100 µm.

