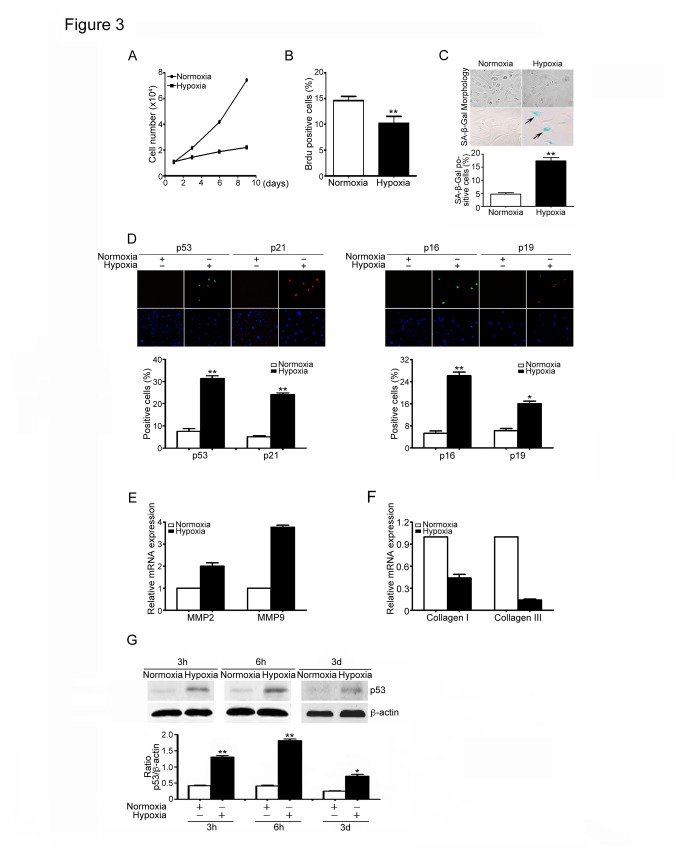
Figure 3. Hypoxia/reoxygenation induces senescence in cardiac fibroblasts.
(A) Neonatal cardiac fibroblasts from wild-type (WT) mice were treated with hypoxia/reoxygenation (H/R) for 0-10 days. The growth of viable cells was measured by using Trypan blue staining. Bar graphs show the number of viable cells at day 0-10 of H/R treatment. (B) Cells were culture as in A for 3 days. Cell proliferation was measured by using BrdU incorporation assay. Bar graphs show the percentage of BrdU positive cells. (C) Morphology and SA-b-Gal staining of fibroblasts treated with hypoxia were viewed and performed (left). Bar graph shows the percentage of SA-β-Gal positive cells (right). (D) Cells treated with hypoxia were subjected to immunostaining using anti-p16, p19, p21 and p53 (markers of senescence). DAPI was used for counterstaining (left). Bar graphs show the percentage of senescence marker positive cells (right). (E, F) qPCR analysis was used to quantify the mRNA expression of MMP2, MMP9, collagen I and collagen III in fibroblasts treated with hypoxia. Bar graphs show the relative mRNA levels in hypoxia-treated cells compared with normoxia group. (G) p53 protein levels were detected by Western Blot analysis in fibroblasts treated with hypoxia for 3 h, 6 h and 3 d. Bar graphs show the quantitative analysis of p53 protein (right). Scale bars: 50 µm. Data expressed as mean±SEM (n=3). *P<0.05, **P<0.01, ***P<0.001 vs. normoxia.

