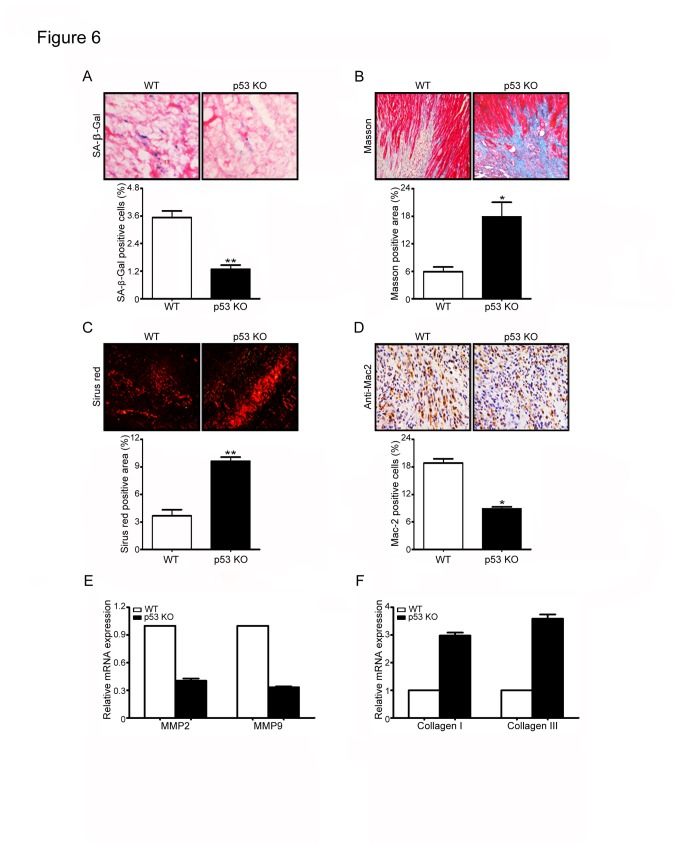
Figure 6. Deficiency of p53 inhibits fibroblast senescence but enhances cardiac fibrosis after infarction.
(A) Wild-type (WT) and p53 knockout (p53 KO) mice underwent left coronary artery ligation for 7 days. Heart sections were stained by SA-β-Gal kit (left). Bar graph shows the percentage of SA-β-Gal-positive cells in the heart (right). Heart sections were examined using Masson’s trichrome (B) or Sirius Red staining (C) (left). Bar graphs show the areas of collagen deposition in the heart (right). (D) Heart sections were stained by immunohistochemistry with anti-Mac-2 antibody (left). Bar graph shows the percentage of Mac-2 positive cells in the heart. Scale bars: 50 µm. (E, F) qPCR analysis was used to quantify the mRNA expression of MMP2, MMP9, collagen I and collagen III in the heart tissue. Bar graphs show the relative mRNA levels in p53 KO mice compared with WT mice. Data expressed as mean ± SEM (n=5 per group). *P<0.05, **P<0.01 vs. WT+MI.

