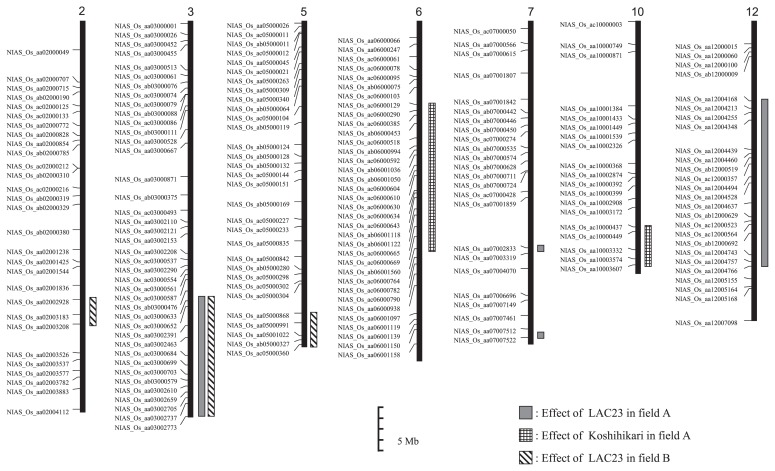
Fig. 3.
SNP linkage map showing the locations of QTLs for low grain Cd content in 32 CSSLs derived from LAC23 × Koshihikari. Chromosome numbers are indicated above; marker names are on the left. Bars represent chromosome regions exceeding a threshold F-test value for low grain Cd content according to 1000 permutations.

