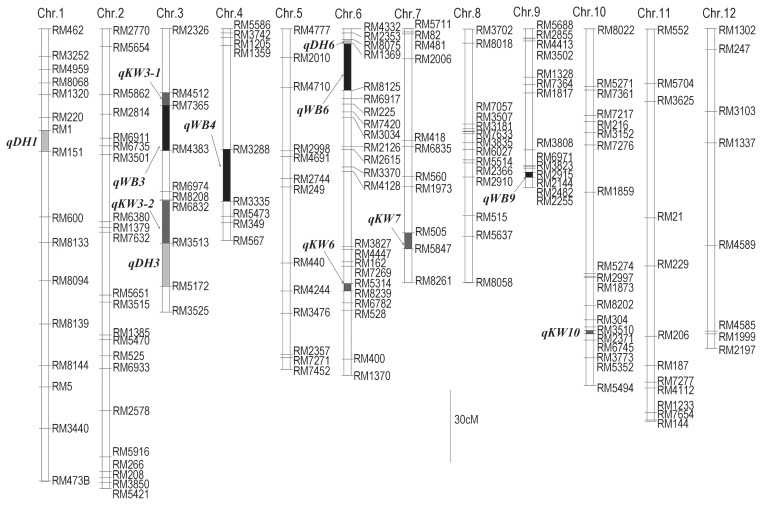
Fig. 2.
HE × NW linkage map and putative QTLs for occurrence of WBK, KW and DTH detected in RIL population. Blocks represent chromosomes. Black, dark gray and light gray blocks represent marker intervals where LOD peaks were detected for WBK, KW and DTH, respectively. SSR markers mapped to the same position are omitted.

