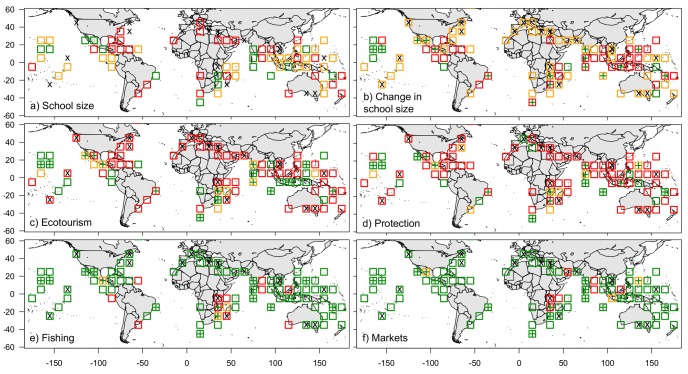
Figure 3. Global distribution and human use patterns from the eManta survey.
In general green indicates positive (large school sizes, increasing populations, ecotourism and no fishing or markets), red indicates negative (small school sizes, decreasing population sizes, no ecotourism and markets); a) school size (x = zero, red = 1–5, orange = 6–20, green = >20 individuals), b) reported change over time in school size (green = increase, red = decrease, orange = no change), c) ecotourism (green = present, red = absent, orange = combination where not all respondents reported the same observation, d) protective measures (green = present, red = absent, orange = combination), e) fishing (green = absent, red = present, orange = combination), f) markets (green = absent, red = present, orange = combination). Green crosses in b–f indicate cells with large school sizes (>20 individuals from 3a), black crosses denote cells where mobulids were not observed. Note that only some part of each cell may be observed.

