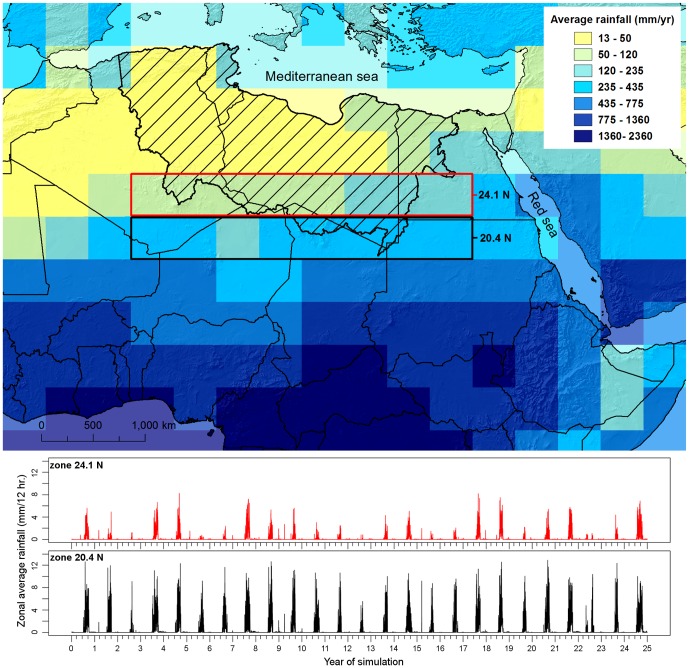
Figure 1. Palaeorainfall used to drive the combined numerical model.
Yearly average rainfall from a 25 year snapshot of an ESM experiment and catchment area (hatched region) as well as the time series of zonally averaged precipitation for two stripes south of the catchment highlighting the (i) South-North gradient of rainfall during the wet seasons (June to September) and (ii) the modelled year to year variability of the monsoon system. The data is drawn from 12 hourly precipitation data produced during a time-slice experiment [27] of the last Interglacial (MIS 5e, ∼124 ka BP) performed by the fully coupled atmosphere-ocean- sea ice-biosphere general circulation model of the Max-Planck-Institute for Meteorology. The ESM consists of the spectral atmosphere model ECHAM5 [43] including the land surface model JSBACH [44] and a dynamic vegetation module [65] coupled to the general circulation ocean model MPIOM [45]. The model runs for the atmosphere at a truncation T31, which corresponds to a horizontal resolution of ∼300 km in the area under investigation.

