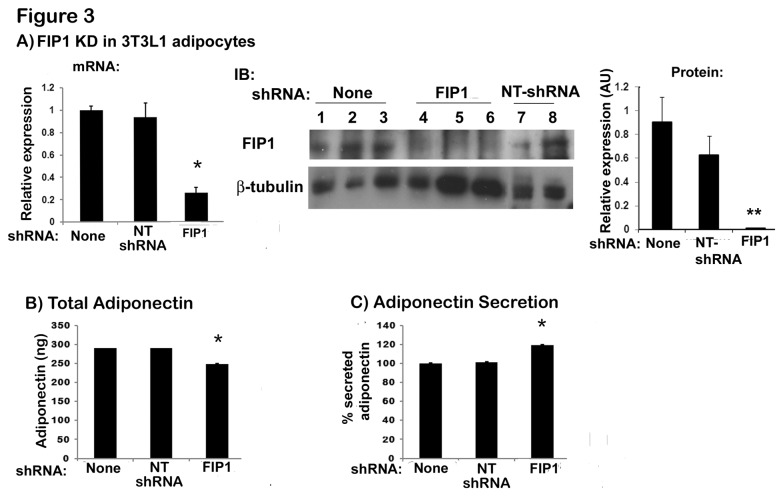
Figure 3. Knock down of FIP1 in 3T3L1 adipocytes increases adiponectin secretion.
3T3L1 cell lines stably expressing non-targeting shRNAs or shRNAs for FIP1 were generated as described in the methods section. Cells were cultured in the presence of 3-5 µg/ml puromycin to select for shRNA expressing cells and subsequently differentiated into adipocytes and used on day 10 after differentiation. A) Knock down of FIP1 in adipocytes. Left panel: total RNA was extracted from control (uninfected), non-targeting shRNA expressing and FIP1 shRNA expressing cells, and the mRNA for FIP1 was quantified by qPCR. Gene expression was normalized to Cyclophilin A using the ΔΔCT method. Graph is the mean ± SEM of 3 independent experiments each quantified in triplicate. Statistical analysis: one way ANOVA. *indicates p<0.05 relative to control cells. Middle panel: Cell lysates were obtained from differentiated control (non-infected) cells, cells expressing FIP1 specific shRNAs or non-targeting (NT) shRNAs. Samples were separated by SDS-PAGE, transferred to nitrocellulose filter and immunoblotted with an anti-FIP1 antibody or anti β-tubulin antibody as shown. The right panel shows quantification of the western blot normalized to tubulin. Statistical analysis: one way ANOVA, ** indicates p<0.01 relative to control non-infected cells. B) Adiponectin expression. Total intracellular adiponectin content was determined in control (non-infected) cells, in cells expressing non-targeting shRNAs or shRNAS for FIP1. Cellular lysates were obtained from fully differentiated cells, and adiponectin content quantified as described in the methods section. Data from two independent experiments, with n=5 replicates each. Data are mean ± SEM. * Statistic analysis: one way ANOVA, * indicates p<0.05 relative to control cells. C) Adiponectin secretion. Culture media and cell lysates were obtained from control cells (non infected), non-targeting shRNA expressing cells, or FIP1-depleted cells the amount of adiponectin quantitated using ELISA. Secretion was calculated as indicated in the methods section. Secretion is expressed as a percentage of total adiponectin expressed. Data from two independent experiments, with n=5 replicates each. Data are mean ± SEM. * indicates statistically different from control cells (p < 0.05). NT shRNA = non-targeting shRNA.

