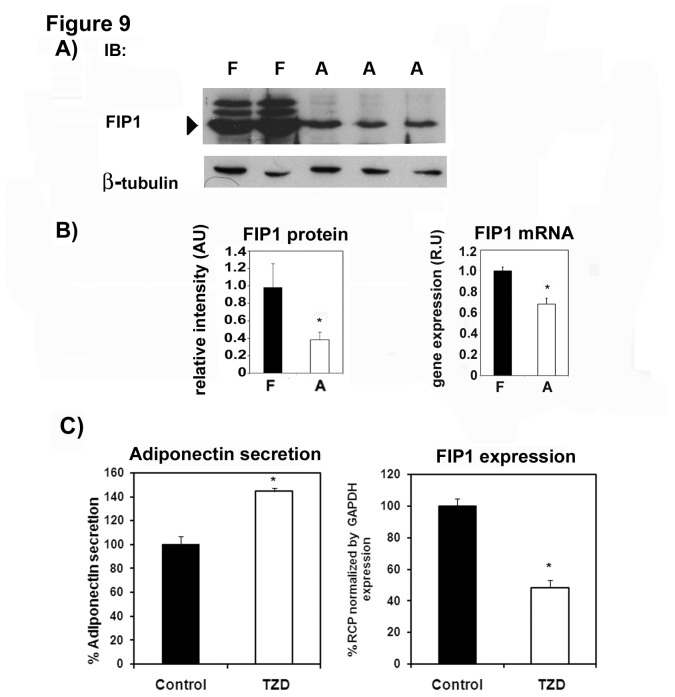
Figure 9. FIP1 expression decreases during adipogenesis, and by treatment with troglitazone.
A) Cell lysates were obtained from 3T3L1 fibroblasts (F) or fully differentiated adipocytes (A). Samples were separated by SDS-PAGE, transferred to a nitrocellulose filter and immunoblotted with an anti-FIP1 or β-tubulin antibody as shown. Representative blot of two independent experiments. B) Quantification of FIP1 protein levels (left panel) or FIP1 mRNA levels (right panel) following the differentiation of 3T3L1 cells to adipocytes. Data shows mean ± SEM of triplicate values. Statistic analysis: One way ANOVA * indicates p<0.05. C) 3T3L1 cells were cultured and differentiated to adipocytes. At day 8 of differentiation, cells were either left untreated or treated with vehicle or with 10 µM troglitazone for 3 days. Conditioned media and cellular lysates were harvested for adiponectin quantification by ELISA as described in the methods section A subset of cell plates were used for total RNA isolation and mRNA for FIP1 was quantified by real time PCR as described in the methods section. Data shows mean ± SEM of 2 independent experiments each performed in triplicate. Statistical analysis, one way ANOVA: * indicates p<0.05.

