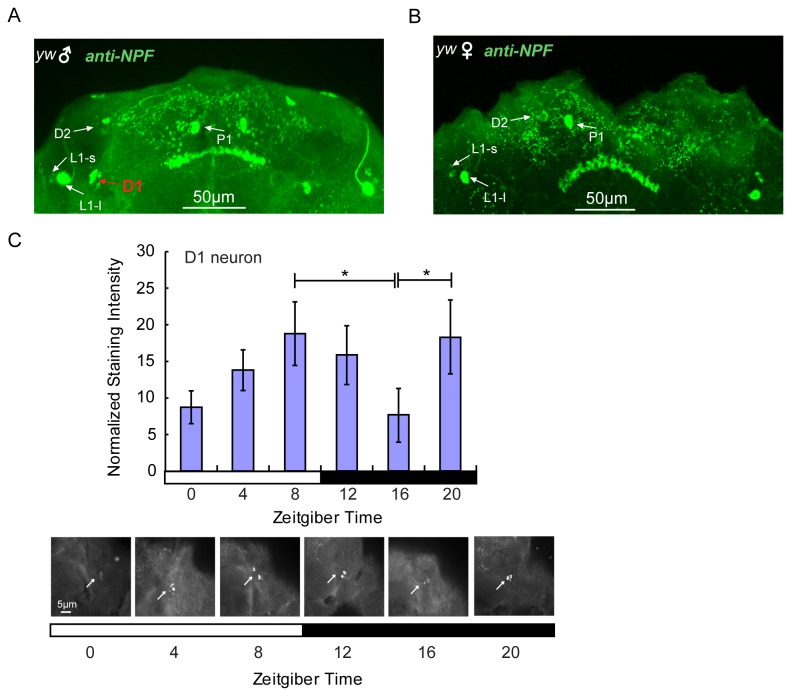
Figure 7. Male specific expression of NPF in male brain.
(A) anti-NPF labeled NPF localization in male brains in which D1 is male-specific. (B) NPF localization in female brains in which D1 is not detected. (C) NPF oscillation in male-specific D1 neurons. The arrows in the images represent the staining intensity of NPF at ZT0, ZT 4, ZT8, ZT12, ZT16 and ZT20. The ZT8 and ZT20 are compared with ZT16 for statistical difference analysis (*, p < 0.05). Scale bar: 5 µm for neuron figures.

