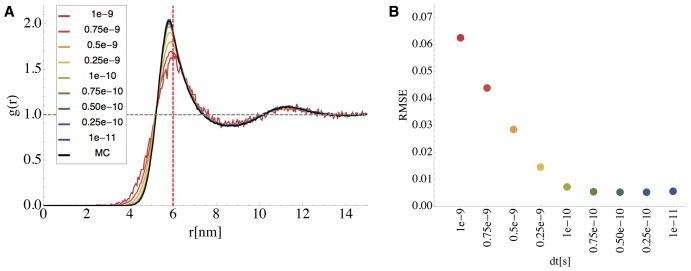
Figure 6. Determination of the Brownian Dynamics Time Step Length  .
.
A: Dependency of the computed radial distribution function  for different time step lengths
  . The black line shows the exact
  of
of  -particles computed by Monte Carlo. The interaction potential was chosen to be a softcore repulsion potential (
 ) when their distance is closer than the sum of their collision radii
  . The colored lines show
  ’s computed from time discretized Brownian dynamics simulations with different timesteps. B: Root mean square error of the difference between Monte Carlo derived g(r) and the discretized diffusion simulation (displayed in same color code as A).

