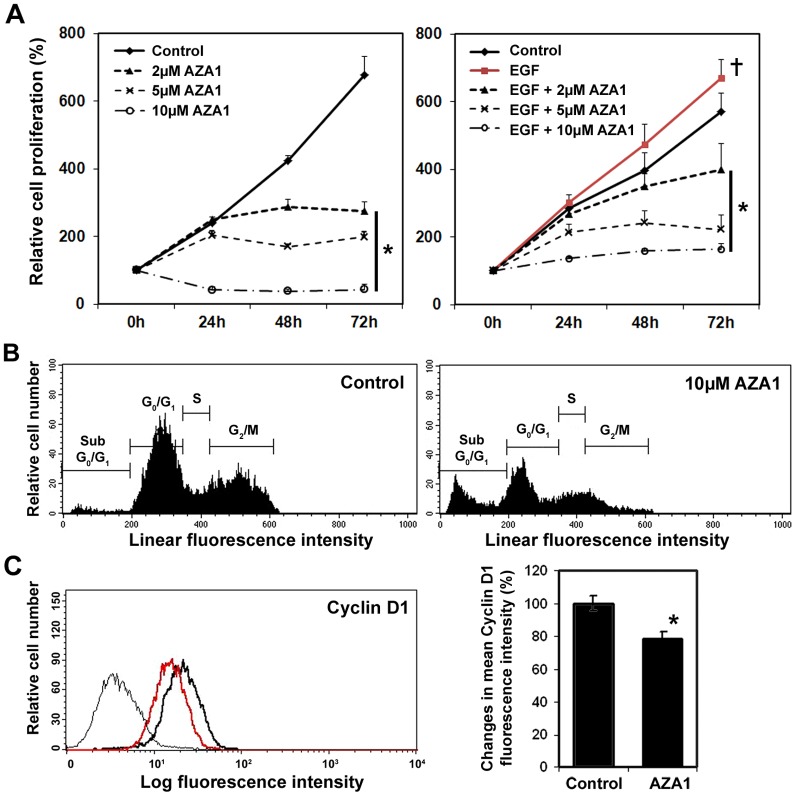
Figure 3. Effects of Rac1 and Cdc42 inhibition by AZA1 on cell proliferation in 22Rv1 prostate cancer cells.
A, Relative density of cancer cells up to 72 h following treatment with 2, 5, and 10 µM compound AZA1 in unstimulated (left panel) or EGF-stimulated (right panel) cancer cells was measured using the WST-1 cell proliferation assay. AZA1 suppresses 22Rv1 prostate cancer cell proliferation in both unstimulated and EGF-stimulated cancer cells in a dose-dependent manner. Means of three independent experiments are shown. *, significantly different from control (left panel) and from control and EGF-stimulated cells (right panel); +, significantly different from control (right panel);. B, Representative flow cytometry histograms showing cell populations in sub- G0/G1, G0/G1, S and G2/M phases. 22Rv1 cells were incubated with 10 µM AZA1 for 24 h. Control cells received no treatment. Cellular DNA content was analyzed by flow cytometry after staining with propidium iodide. C, Cyclin D1 expression. Representative flow cytometry analysis and quantification of fluorescence intensity in 22Rv1 cells treated with 10 µM AZA1 for 60 min (red histogram) compared to untreated cells (bold line) and isotype controls (thin line). Compound treatment reduced Cyclin D1 levels. *, significantly different vs. control.

