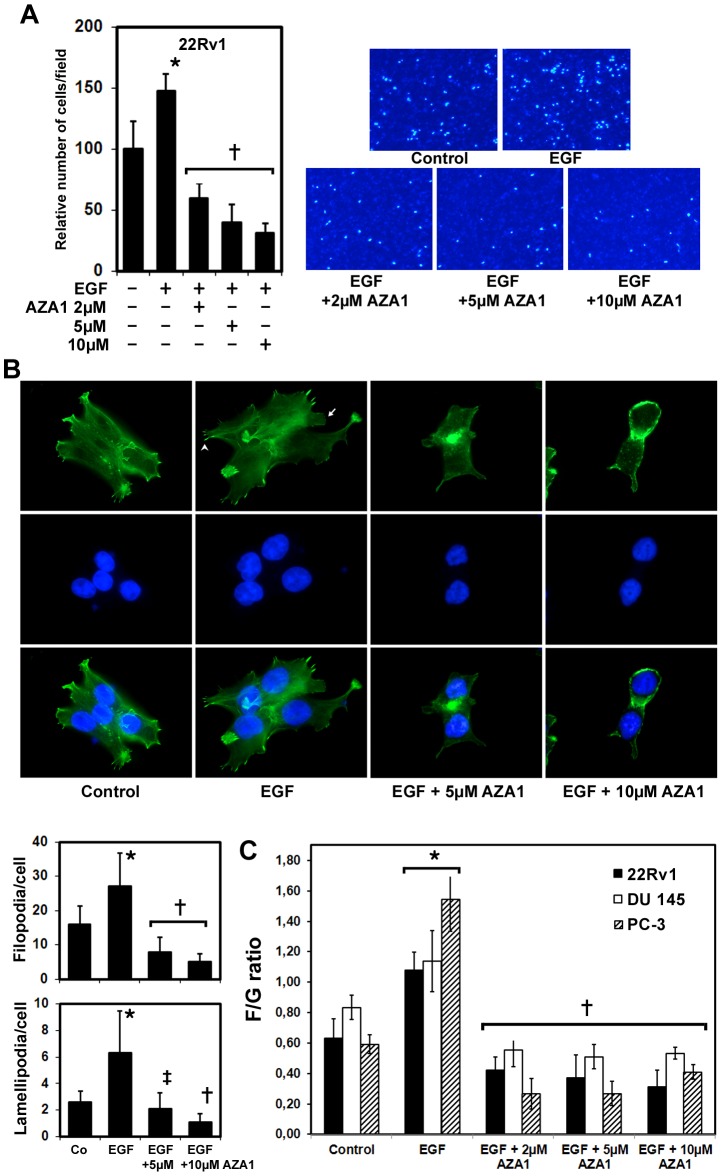
Figure 4. Rac1 and Cdc42 blockade reduces prostate cancer cell migration and affects cytoskeletal dynamics.
A, Representative images of migrated prostate cancer cells from an in vitro migration assay are shown. 22Rv1 prostate cancer cells were stimulated with 50 ng/ml EGF and treated with 2, 5 or 10 µM AZA1 for 24h and migrated cancer cells quantified subsequently in in vitro migration assays. Data were collected from five individual consecutive fields of view (40x) from three replicate Boyden chambers. *, significantly different from control; +, significantly different from control and EGF-stimulated cells. B, Effect of AZA1 treatment on lamellipodia and filopodia formation. 22Rv1 prostate cancer cells were plated on cell culture chambers, stimulated with 50 ng/ml EGF and incubated with 5 and 10 µm AZA1 for 24 h. Paraformaldehyde fixed cells were stained with Atto-488 phalloidin (F-actin, green) to detect polymerized actin cytoskeleton, filopodia and lamellipodia and counterstained with DAPI (blue) and photographed (magnification, x1000). Arrow head indicates filopodia, arrow indicates lamellipodia. The numbers of filopodia and lamellipodia per cell were calculated from 25 cells in each group. AZA1 leads to changes in cellular morphology and suppresses filopodia and lamellipodia formation. *, significantly different from controls; +, significantly different from controls and EGF-stimulated cells; ‡, significantly different from EGF-stimulated cells. Co, control. C, Effect of AZA1 on actin dynamics. Expressions of F-actin and G-actin in 22Rv1, DU 145 and PC-3 cells analyzed by immunoblotting (F-actin/G-actin ratio). Bars represent the F/G actin mean value ±SD. *, significantly different from controls of the respective cell line; +, significantly different from controls and EGF-stimulated cells of the respective cell line.

