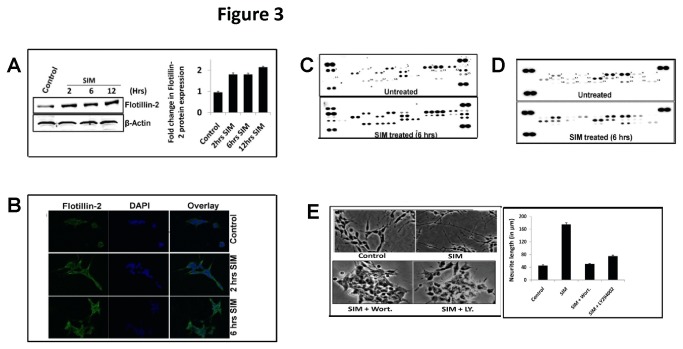
Figure 3. SIM retained CSC modifies various RTK’s and MAPK’s during neuritogenesis.
A) Immunoblot showing significant (p < 0.05*) increase in protein levels of Flotilin-2 (a lipid raft marker) after SIM treatment from 2 hrs onwards. Error bar graph represents the fold change in protein levels with respect to untreated sample (mean ± SEM; n = 3). B) Confocal image at 60 X magnification showing marked increase in surface distribution of Flotilin-2 protein after SIM treatment till 6 hrs. For detection of Flotilin-2 protein, FITC-labeled secondary antibody was used which is shown as green fluorescence. Scale Bar = 10 µm. C) p-RTK protein array blot showing detection of various kinases represented as dots. Each kinase has been denoted by number as shown in blot and corresponding fold change in phosphorylation (ratio of SIM treated and untreated cells) at 6 hrs has been shown on right hand side of blot. The result is average of two experiments. Increased phosphorylation of various RTK’s like EGFR, ErbB4, FGFR2α, Insulin R, Dtk, MSPR, PDGF Rβ, Flt-3, c-Ret, ROR1, ROR2, Tie-2, MUSK, Eph B2, Eph A4, Eph B4 and Eph B6 was observed after SIM treatment D) p-MAPK protein array blot showing detection of various kinases represented as dots. Each kinase has been denoted by number as shown in blot. E) Morphology of SH-SY5 cells at 10 X magnification under light microscope showing significant (p < 0.001) reduction in neuritogenesis after addition of PI3K inhibitors i.e. wortmannin (Wort.) and LY294002 (LY.) at 12 hrs post SIM treatment. Each inhibitor was used at a concentration of 10 µM. The change in neurite length (in μm) is represented by error bar graph (mean ± SEM; N = 50 cells per condition from 3 separate cultures). Scale Bar = 100 µm.

