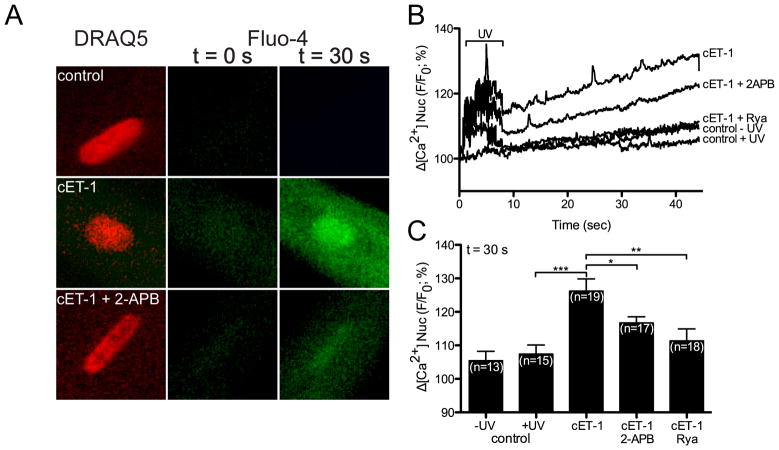
Figure 8. Ryanodine and 2-APB inhibit the increase in nucleoplasmic [Ca2+] induced by photolysis of a caged ET-1.
A) Nucleoplasmic [Ca2+] recorded in rat ventricular myocytes before and after photolysis in cells preincubated with vehicle, 1 μM caged ET-1 (cET-1), or 1 μM caged ET-1 plus 20 μM 2-APB. B) Nucleoplasmic [Ca2+] recorded before and after photolysis in cells preincubated with 1 μM caged ET-1 (cET-1), caged ET-1 plus 20 μM 2-APB, ryanodine (Rya) or media alone (control). Controls were performed both with (control + uv) and without (control - uv) uv irradiation. DRAQ5 fluorescence was used to select the region corresponding to the nucleoplasm. Signals are presented as background-subtracted normalized fluorescence (%F/F0), where F is the fluorescence intensity, and F0 is the resting fluorescence recorded in the same cell under steady-state conditions prior to photolysis. C) For each condition shown in Panel B, the mean ± s.e.m. of nucleoplasmic Fluo-4 fluorescence at 30 s after photolysis is presented as a histogram. Number of cells is indicated in parentheses. *, p<0.05; **, p<0.01; ***, p<0.001.

