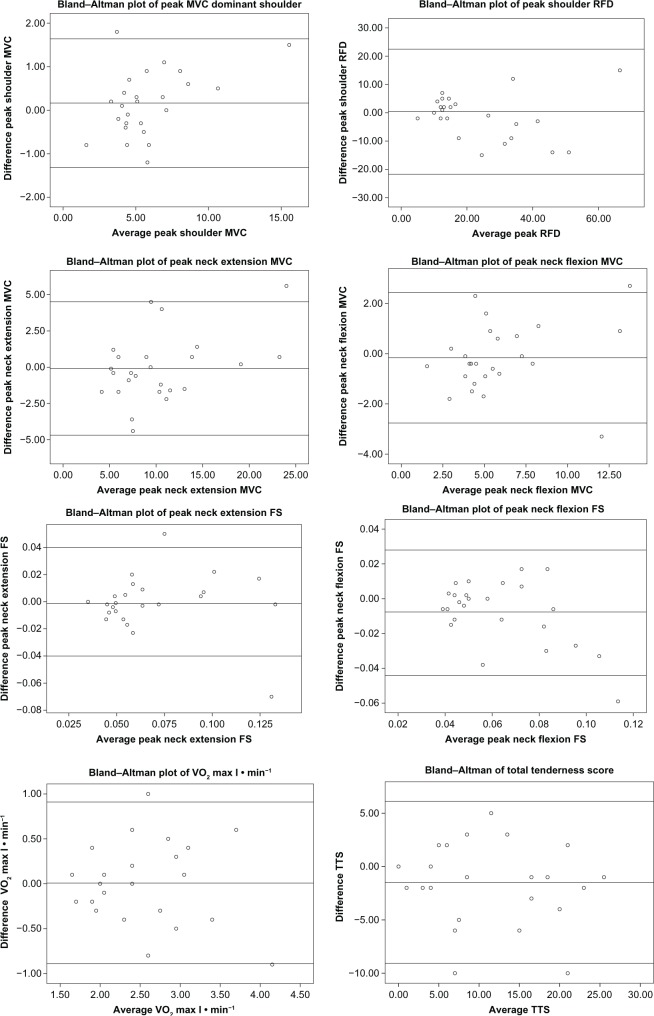
Figure 2.
Bland–Altman plots of peak variables, VO2 max l · min−1 and total tenderness score.
Notes: The middle reference line shows the mean difference (test 2 − test 1) and the two additional lines ±2 SD.
Abbreviations: FS, force-steadiness; MVC, maximal voluntary contraction; RFD, rate of force development; SD, standard deviation; TTS, total tenderness score; VO2 max, predicted maximal oxygen uptake.

