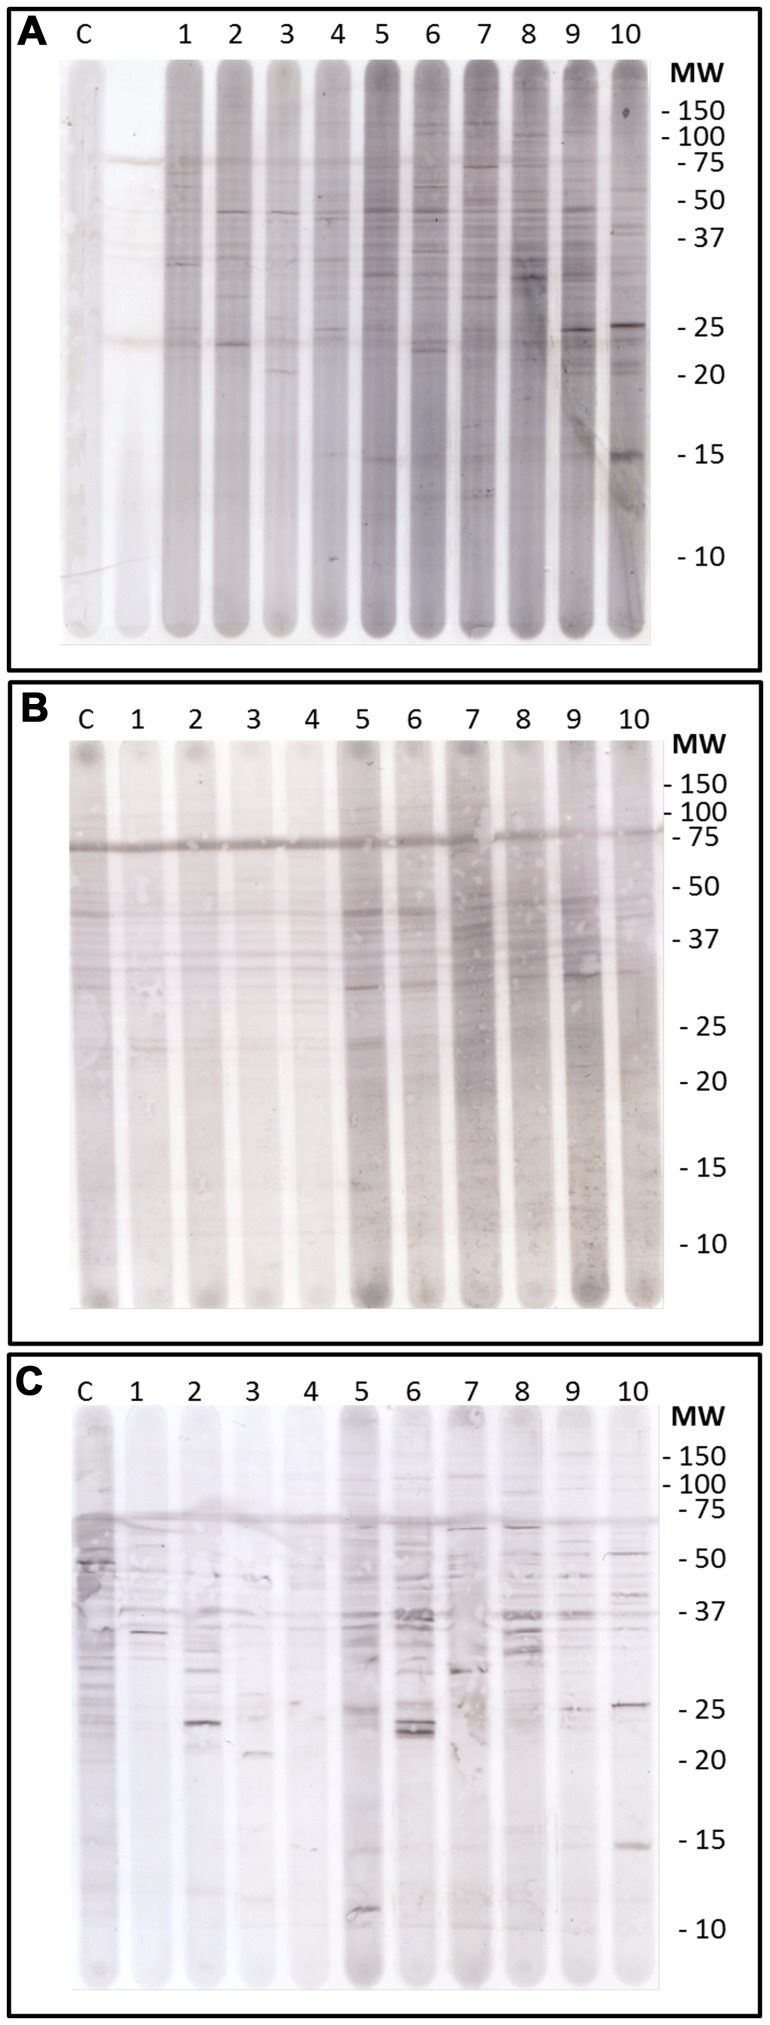
Figure 1. Western Blots representing the same set of birds for different isotypes.
From top to bottom: A) IgTotal, B) IgM and C) IgG. Lanes 1–4: genotypically low (Lg) hens, 5–10: phenotypically high (Ch) hens, C = positive control (rooster plasma), m = marker, and other lanes are negative control (dilution fluid).

