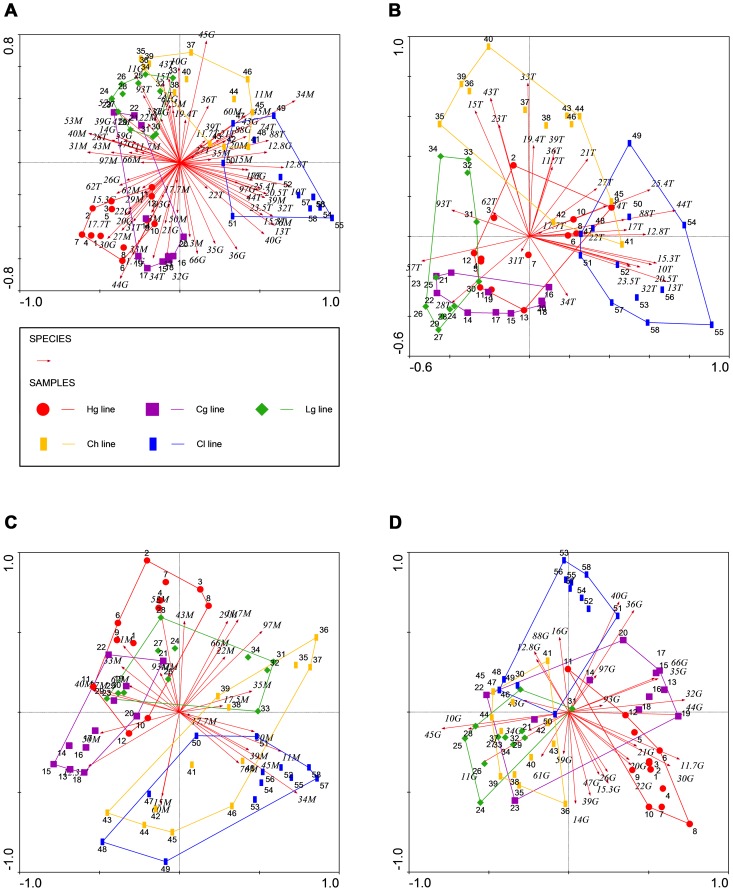
Figure 3. Correlation of staining patterns of all bands stained by all isotypes (A) or stained by IgTotal (B), IgM (C), and IgG (D) autoantibodies to CLL.
Chickens were one year of age and divergently selected for 29 generations for High (red circles: Hg), Low (green diamonds: Lg), and Control (purple squares: Cg) agglutination titres to SRBC at 5 weeks of age, and C line birds phenotypically selected for high (yellow bars: Ch) or low (blue bars: Cl) NAb levels to KLH at 16 weeks of age. Ordination plots by PCA. Graphs include 11–12 birds from each line as also used for Figures 1 and 2. Only CLL fragments that showed significant line differences for staining intensity (Tables 4–6) are shown. ‘Eigenwaardes’ were 12.8% horizontal and 11.1% vertical axes (A), 17.9% horizontal and 11.6% vertical axes (B),16.5% horizontal and 15.4% vertical axis (C), and 20.8% horizontal and 12.5% verical axis (D), respectively. Numbers in Ithalic represent CLL fragments most informative for line clustering.

