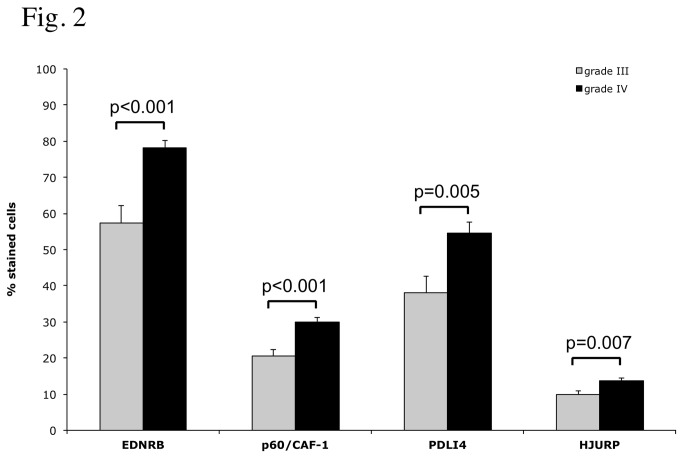
Figure 2. Immunohistochemical analyses of marker expression in grade III and grade IV gliomas.
A statistical analysis of the difference in the percentage of positive cells for each marker between grade III (32 cases) and grade IV specimens (64 cases) is presented. P-values were obtained by applying a Wilcoxon rank sum test to each comparison.

