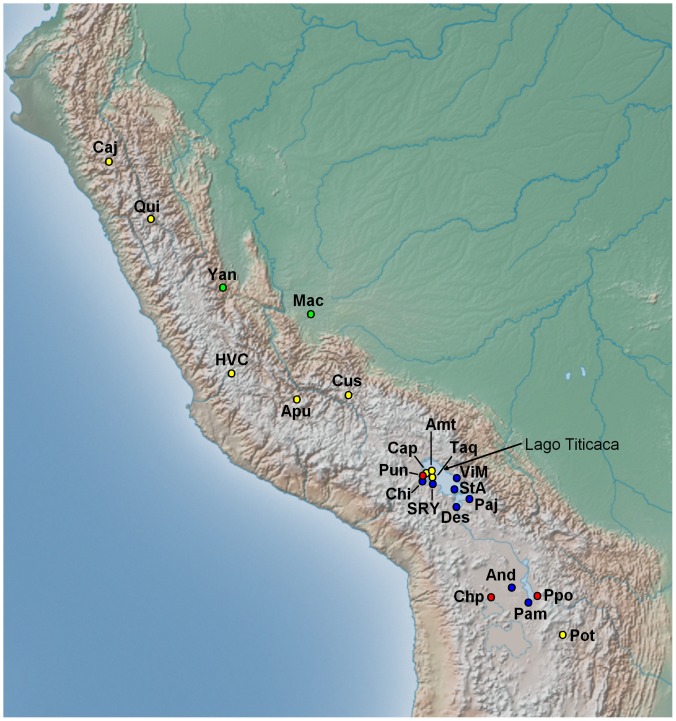
Figure 1. Map of the western South America showing the Andes and locations of the 22 Peruvian and Bolivian populations under study.
Population codes are found in Materials and Methods (Sampling section). Yellow circles represent Quechua populations, blue circles represent Aymara, green circles represent Arawak, and red circles represent Uroś populations. A detailed map of the Andean Altiplano region can be seen in Figure S2.

