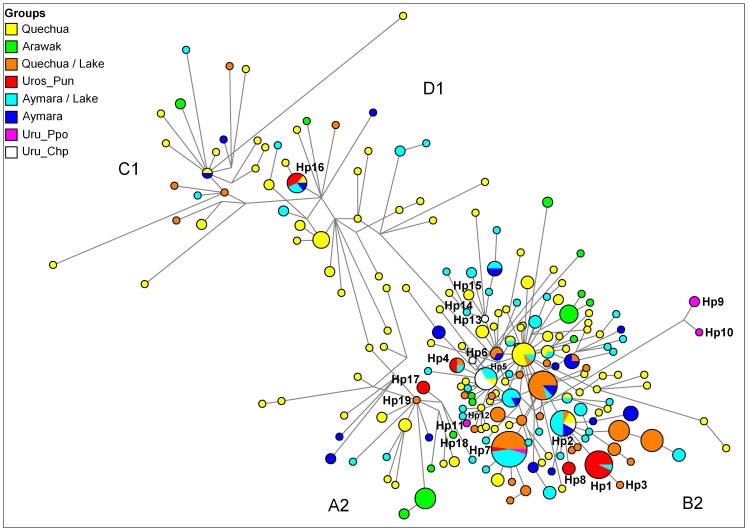
Figure 4. Median Joining network of mtDNA control region haplotypes found in 22 Peruvian and Bolivian populations.
Different population groups are defined by distinct colors, where Aymaran and Quechuan communities from the border of the lakes (Titicaca and Poopo) are discriminated. The mtDNA haplotypes (Hp#) are represented by circles with sizes proportional to numbers of individuals (Hp10 = 1 individual), and branch lengths are proportional to nucleotide changes (1 mutation step between Hp1 and Hp3). Clusters of haplotypes into four mtDNA haplogroups (A2, B2, C1, D1) are indicated.

