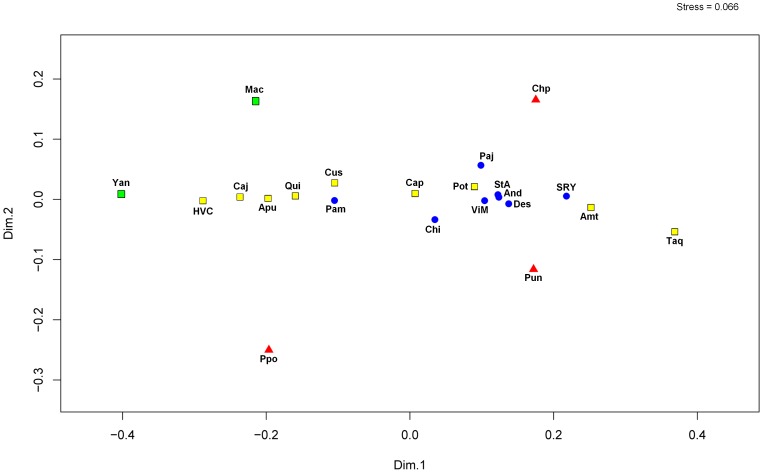
Figure 5. Non-metric MDS plot generated with PAST for mtDNA control region sequences for all haplogroups among 22 Bolivian and Peruvian populations.
It was used Reynolds’ Φst genetic distances among populations. Uros: red triangles, Aymaras: blue circles, Quechuas: yellow squares, and Arawaks: green squares.

