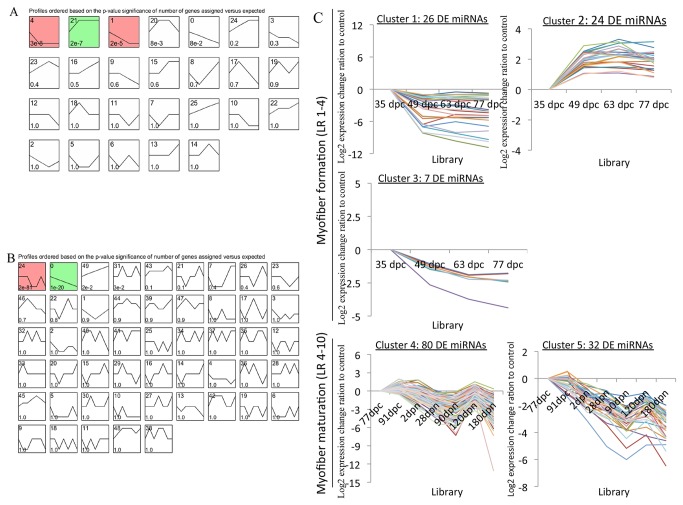
Figure 4. Clustering of miRNA expression profiles.
A–B. Each box corresponded to a model expression profile and only colored profiles reached statistical significance. The upper-left number in the box gave information about the order of profile (upper left) and the p-value significance (bottom left). A. 26 clusters of 87 DE miRNAs during myofiber formation, the first three of which showed statistically significant; B. 50 clusters of 166 DE miRNAs during myofiber maturation, the first two of which showed statistically significant. C. Five significant clusters of miRNA profiles during myofiber formation (cluster 1-3) and myofiber maturation (cluster 4-5) were displayed as time course plots of log 2miRNA expression ratios to controls.

