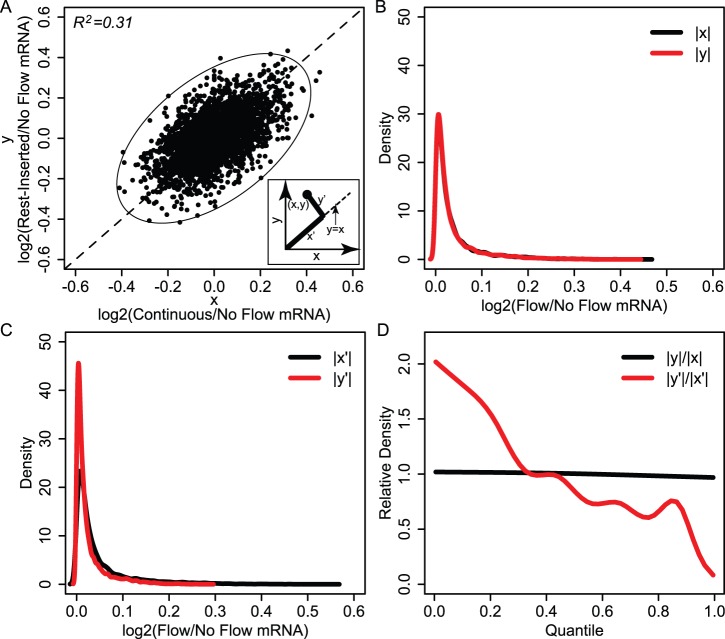
Figure 3. Genome-wide gene expression profiling reveals transcriptomic variations arising from rest-inserted flow.
(A) Microarray gene expression data plotted in (x,y) space. Genes were distributed within an approximately elliptical-shaped region with major axis aligned parallel to y = x. The quantities x’ and y’ (inset) provide measures of common and differential gene expression alterations under the two flow conditions, respectively. (B–C) Density distributions for |x| and |y| (black and red lines respectively in B) and |x’| and |y’| (black and red lines respectively in C). (D) Relative distributions for |y|/|x| (black) |y’|/|x’| (red). For |y|/|x|, the distribution was essentially uniform and equal to one. This is in contrast to the relative distribution for |y’|/|x’|, which exhibited an inverse relation between relative density and quantile.

