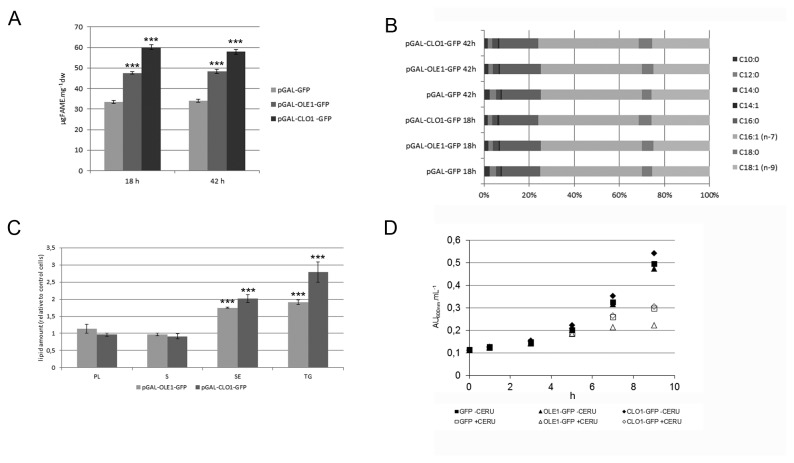
Figure 4. Comparative lipid analysis of yeast strains expressing plant oleosin and caleosin.
Total fatty acid content of GFP, AtOle1-GFP and AtClo1-GFP expressing cells after 18 or 42 h induction in galactose-containing medium was evaluated by gas chromatography after FAME production of freeze-dried samples (A and B). Lipids were also extracted and spotted on silica plates for thin layer chromatography. Each class of lipid was quantified and data were plotted as the amount relative to that obtained for cells expressing GFP alone. Data were expressed as the mean ± SE of three experiments (C). *** Significant difference according to t test, P < 0.001. Growth curves of cells, transformed with pGAL-GFP (squares), pGAL-OLE1-GFP (triangles), pGAL-CLO1-GFP (diamonds) in the absence (filled symbols) or presence (open symbols) of 5 µg.mL -1 cerulenin (inhibitor of fatty acid synthesis). The experiment was repeated twice (D).

