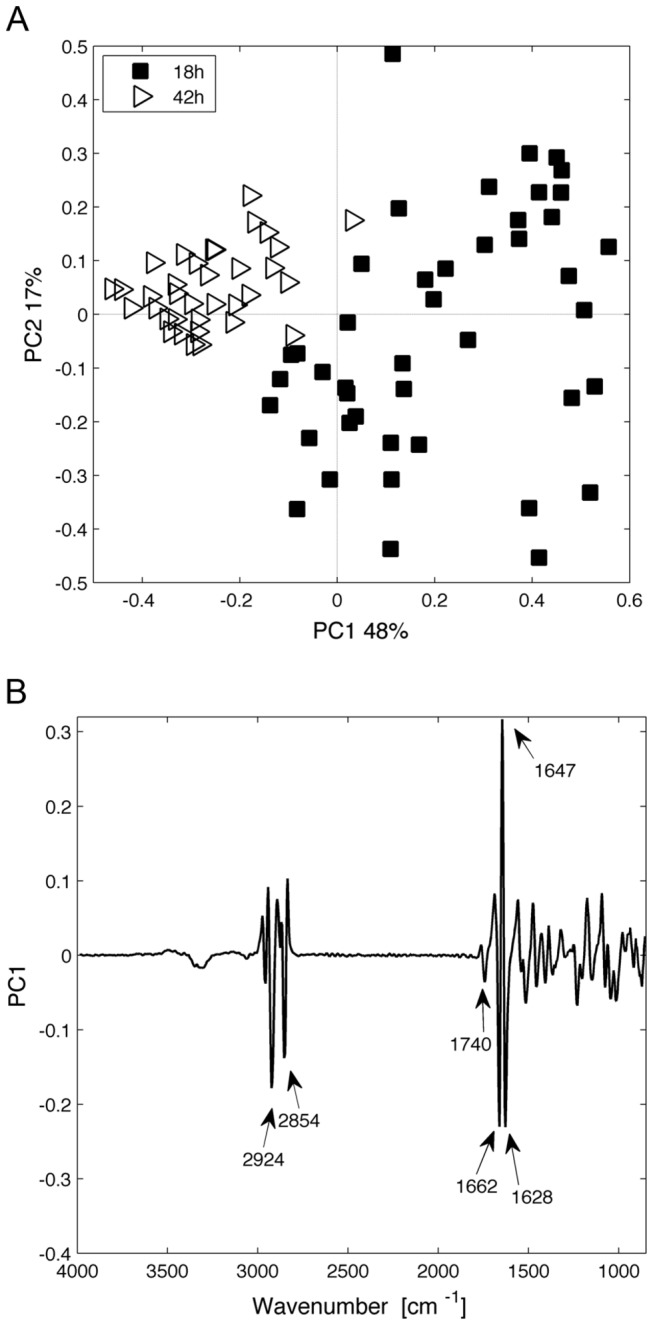
Figure 6. Multivariate statistical analysis (PCA) of spectra obtained for AtClo1-GFP expressing cells after 18 h or 42 h of galactose induction.

(A) Score plot (principal component 1 (PC1) versus principal component 2 (PC2)). Each spectrum is represented by a label and plotted in a pertinent principal component sub-space. (B) The corresponding loading plot of the PC1 axis is presented. The loading plot links the variable space and principal component sub-space (PC1).
