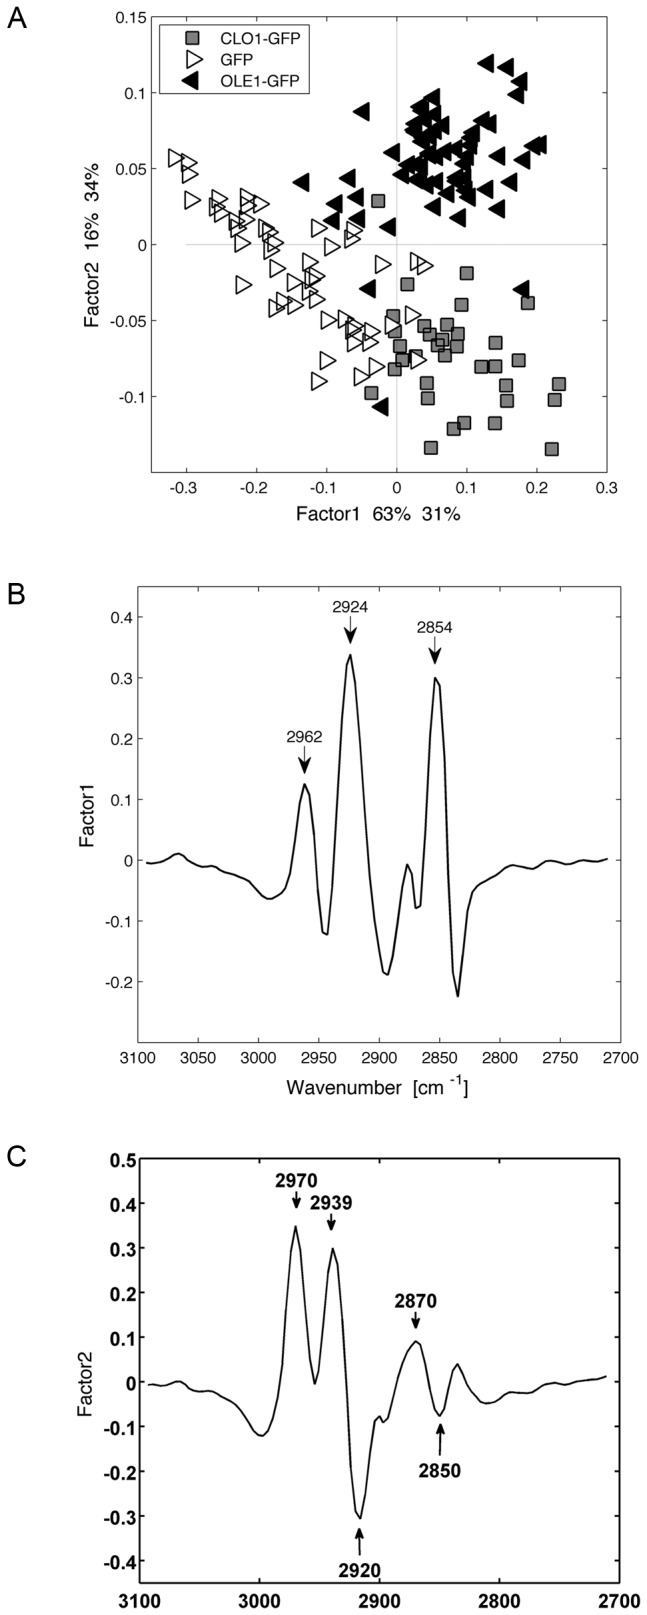
Figure 7. Multivariate statistical analysis (PLS) of spectra obtained for GFP, AtOle1-GFP and AtClo1-GFP expressing cells after 42 h of galactose induction.

Score plot (A) of the factor 1 and factor 2 axes and the corresponding loading plots of the factor 1 (B) and factor 2 axes (C) are presented.
