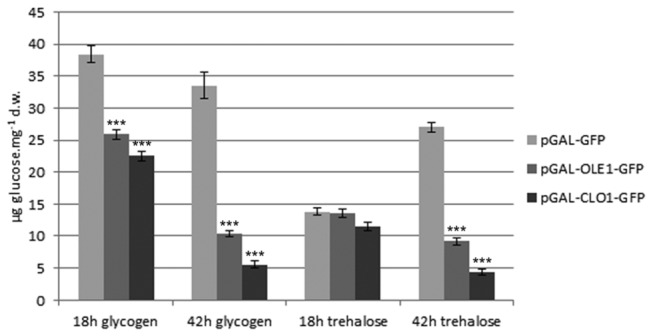
Figure 9. Glycogen and trehalose analysis of yeast cells expressing plant oleosin and caleosin.

The storage carbohydrate, i.e. glycogen and trehalose, content of control, GFP, AtClo1-GFP and AtOle1-GFP expressing cells after 18 or 42 h induction in galactose-containing medium was evaluated using high-performance anion-exchange chromatography after specific enzymatic hydrolysis of freeze-dried samples. Data were expressed as the mean ± SE of three experiments. *** Significant difference according to t test, P < 0.001.
