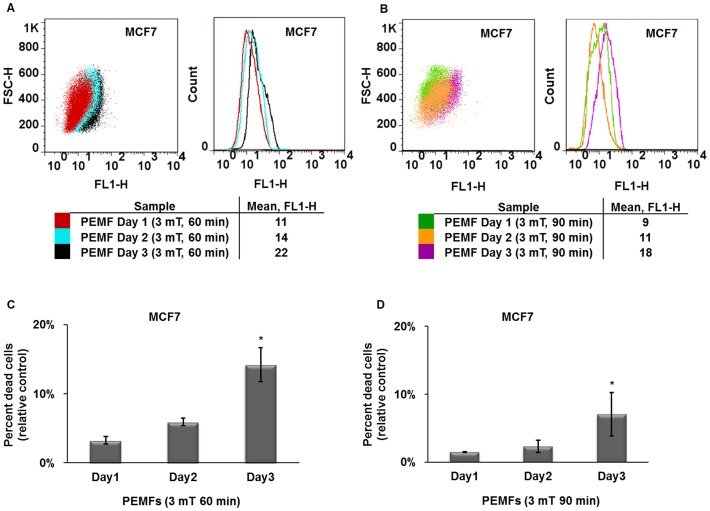
Figure 5. Time course of apoptosis induction by PEMFs in MCF7 cells determined by FCM.
(A) Overlay of MCF7 cells treated with 3 mT PEMFs for 60 min/day for 1, 2 or 3 consecutive days. PEMF-induced DNA damage accrued with time yet, only obtained significance after 3 consecutive days of exposure. (B) Overlay of MCF7 cells exposed to 3 mT PEMFs for 90 min/day for 1, 2 or 3 consecutive days. As in A statistical significance was only achieved after three days. Paralleling our trypan blue (figures 1B, 2 A-D and 3 A-B) and FCM (figure 4 A-D) results, 90 min/day of exposure to PEMFs (3 mT) was less cytotoxic than 60 min/day. (C) Percentage of MCF7 apoptotic cells (relative to control) detected by flow cytometry after exposure to 3 mT PEMFs for 60 minutes per day for 1 day up to 3 days. Values represent the averages of 3, 3 and 5 independent experiments for 1, 2 or 3 days exposure, respectively (1 replicate/experiment (total n = 3, 3, 5, respectively)) (average ± SD); P values, left to right: 0.1, 0.1 and 0.02857. (D) Percentage of MCF7 apoptotic cells after exposure to 3 mT PEMFs for 90 minutes/day for 1, 2 or 3 consecutive days. Values represent the averages of 3, 3 and 5 independent experiments for 1, 2 or 3 days of exposure, respectively (single replicates (total n = 3, 3, 5, respectively)) (average ± SD); P values, left to right: 0.1, 0.1 and 0.02857.

