
Figure 2. Response accuracy for higher fit and lower fit groups on recall day by encoding strategy.
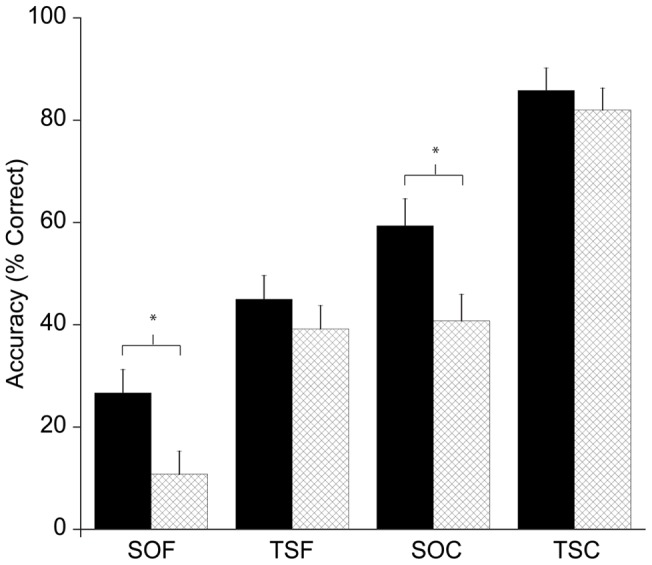
Higher fit performance is represented by the black bars, and lower fit performance is represented by the light bars. SOF represents the map learned using the study only strategy and tested with free recall; TSF represents the map learned using the test study strategy and tested with free recall; SOC represents the map learned using the study only strategy and tested using cued recall; TSC represents the map learned in the test study strategy and tested using cued recall.