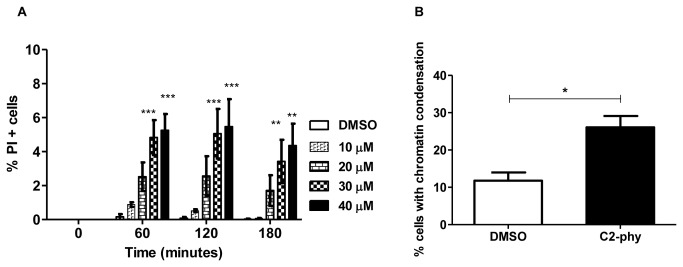
Figure 3. Cell death markers observed after exposure of S. cerevisiae to C2-phytoceramide.
(A) Percentage of PI positive cells in W303-1A cultures exposed to C2-phytoceramide or to equivalent volume of solvent. Values represent mean ± SE of at least 3 independent experiments. Percentages of PI-stained cells of C2-phytoceramide-treated cells (30 µM and 40 µM) significantly different from DMSO-treated cells, P<0.001 for time 60 and 120 min and P<0.01 for time 180 min, Two-Way ANOVA. (B) Percentage of yeast cells with chromatin condensation, determined by counting at least 300 cells per sample after a 120 min treatment with 30 µM C2-phytoceramide or equivalent volume of solvent, in three independent experiments. P<0.05 One-Way ANOVA.

