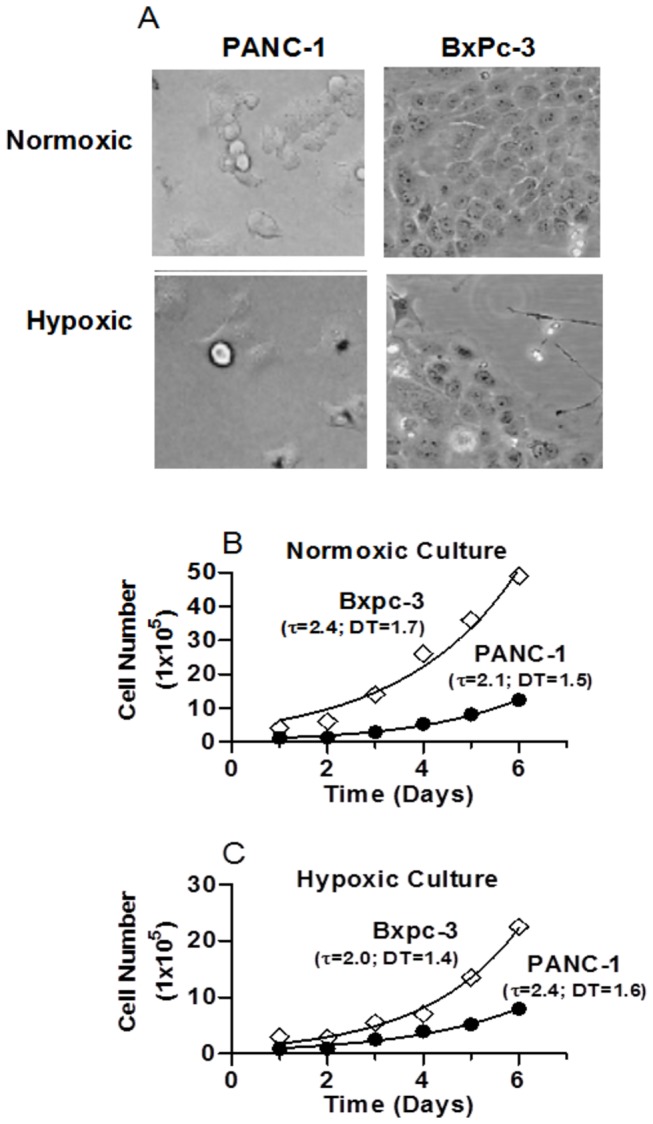
Figure 1. Growth characteristics of human pancreatic cancer cell lines in culture.

(A) Representative photomicrographs of PANC-1 and BxPc-3 cells 72 h after seeding. (B) & (C) Growth curves of PANC-1 and BxPc-3 cells. Symbols are experimental data and curves represent the best fits to exponential growth equation: Y = Y0 × exp(k × X), where Y0 is the Y value when X (time) is zero and K is the rate constant. τ is the time constant (day) and DT (doubling-time) is in the time units of the X axis, computed as ln2/K.
