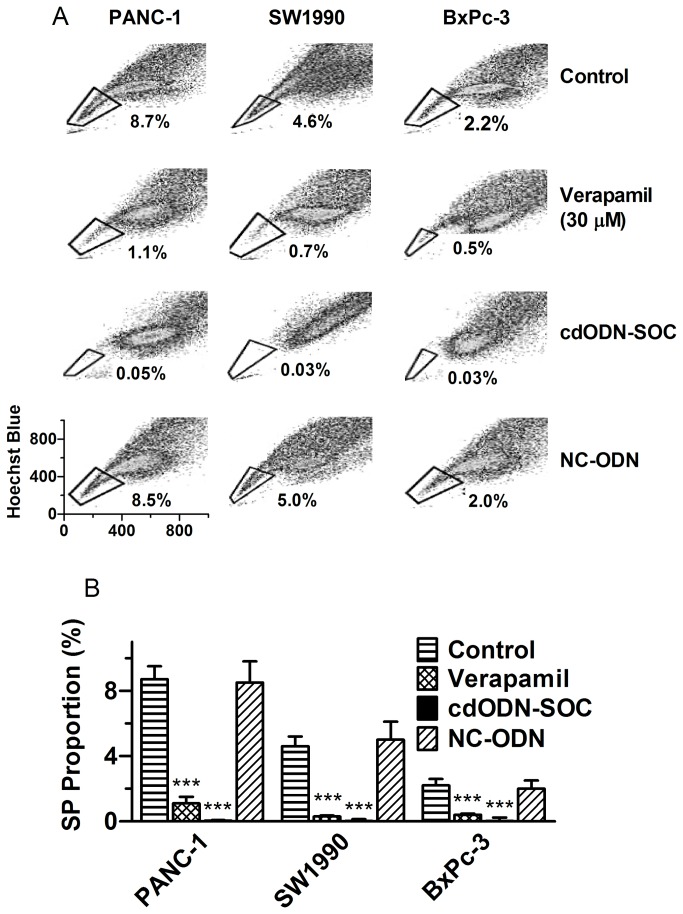
Figure 2. Analysis of the side population (SP) in three human pancreatic cancer cell lines PANC-1, SW1990, and BxPc-3, using flow cytometry and Hoechst33342 dye.
(A) Examples of floe cytometry analysis of SP cells in the presence or absence of 30 µM verapamil, cdODN-SOC (a complex decoy oligodeoxynucleotide carrying cis-elements for Sox2, Oct4 and c-Myc), or NC–ODN (negative control cdODN). (B) The SP proportions as percentage of total population. ***p<0.001 vs Control; n=4.

