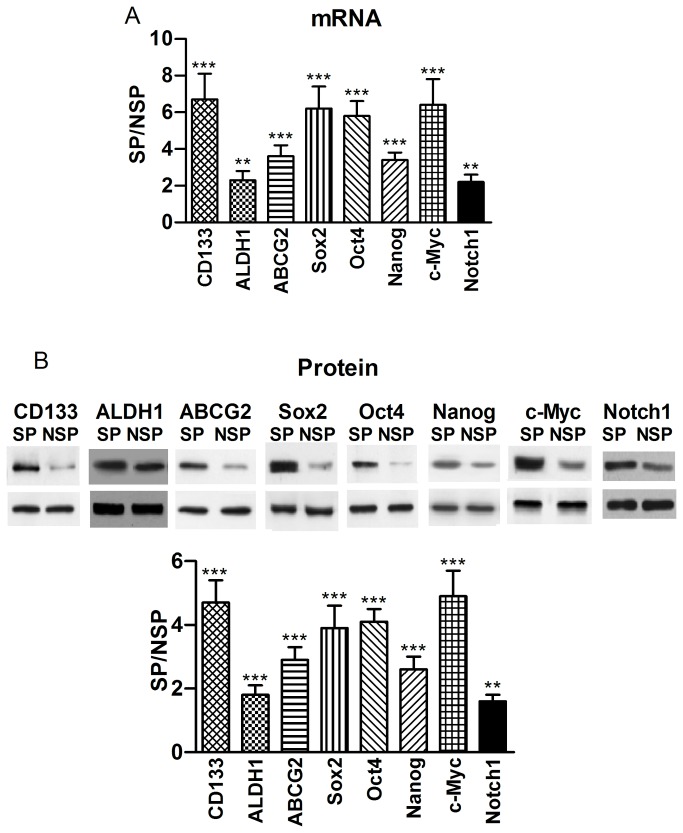
Figure 4. Differential gene expression between PANC-1 SP and NSP cells.
(A) Expression of CD133, ALDH1, ABCG2, Sox2, Oct4, Nanog, c-Myc, and Notch1 at the mRNA level, determined by real-time RT-PCR. The values were obtained by first normalized to GAPDH for internal control and then presented as a ratio of SP over NSP. **p<0.01 SP vs NSP; ***p<0.001 SP vs NSP; n=4. (B) Expression of CD133, ALDH1, ABCG2, Sox2, Oct4, Nanog, c-Myc, and Notch1 at the protein level, determined by Western blot analysis. The values were obtained by first normalized to GAPDH for internal control and then presented as a ratio of SP over NSP. CD133: 120 kDa; ALDH1: 55 kDa; ABCG2: 72 kDa; Sox2: 40 kDa; Oct4: 45 kDa; Nanog: 35 kDa; c-Myc: 62 kDa; Notch1: 300 kDa. **p<0.01 SP vs NSP; ***p<0.001 SP vs NSP; n=4 (Similar results were observed in SW1990 and BxPc-3 cells; Figure S1 and Figure S2 online).

