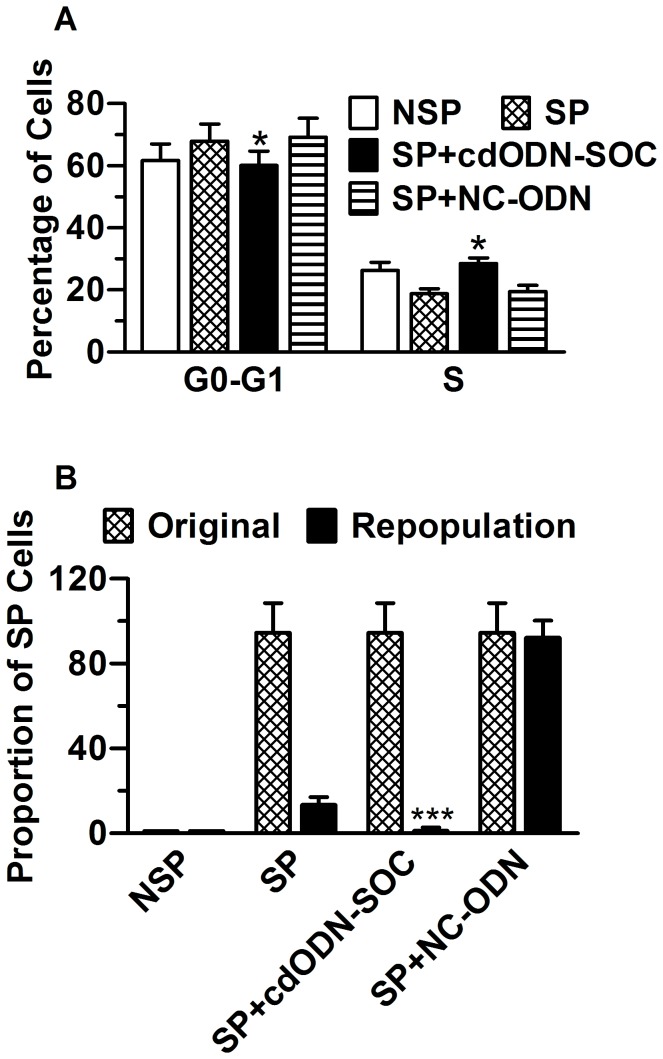
Figure 5. Cell cycle characteristics and differentiation ability of PANC-1 SP and NSP cells.
(A) Percentage of PANC-1 SP and NSP cells in G0-G1 and S cell cycles. Note that cdODN-SOC minimized the difference between SP and NSP. *P<0.05 vs SP alone; n=4. (B) Freshly sorted PANC-1 SP and NSP cells were immediately reanalyzed to ensure the purity, and were cultured for 1 week before re-staining with Hoechst33342 dye and resorted. Note that the SP cells repopulated both SP and significant NSP proportions from the original sort, whereas the NSP generated only NSP cells, and cdODN-SOC eliminated the ability of SP cells to repopulate SP cells. ***P<0.001 vs SP alone; n=4.

