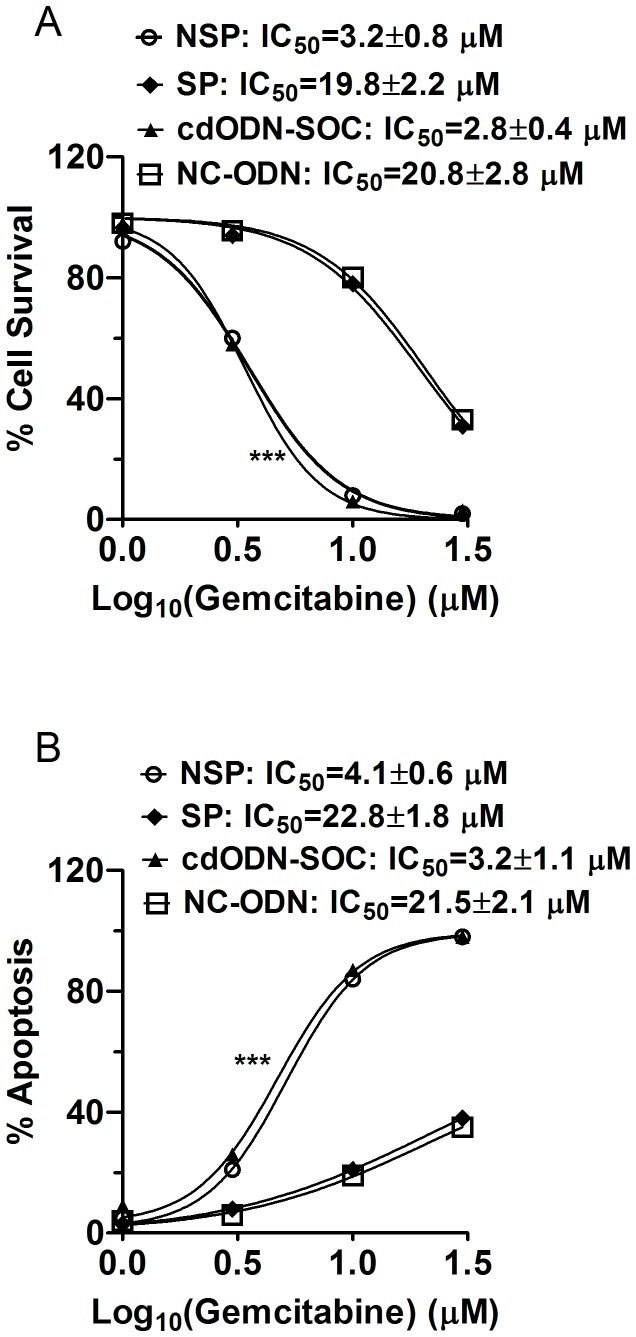
Figure 8. Enhanced drug resistance of SP cells and suppression by cdODN-SOC.
(A) Percent cell survival measured by MTT assay in PANC-1 CSCs. All cells were all treated with varying concentrations of gemcitabine and with lipofectamine 2000. Symbols are experimental data and the lines represent best fits to Hill equation. ***p<0.001 vs SP alone for comparison of IC50 values; n=4. (B) Percent apoptotic cells measured by ELISA to quantify DNA fragmentation in PANC-1 CSCs. All cells were all treated with varying concentrations of gemcitabine and with lipofectamine 2000. Symbols are experimental data and the lines represent best fits to Hill equation. ***p<0.001 vs SP alone for comparison of IC50 values; n=4. Quantitatively the same results were obtained from SW1990 and BxPc-3 CSCs (data not shown).

