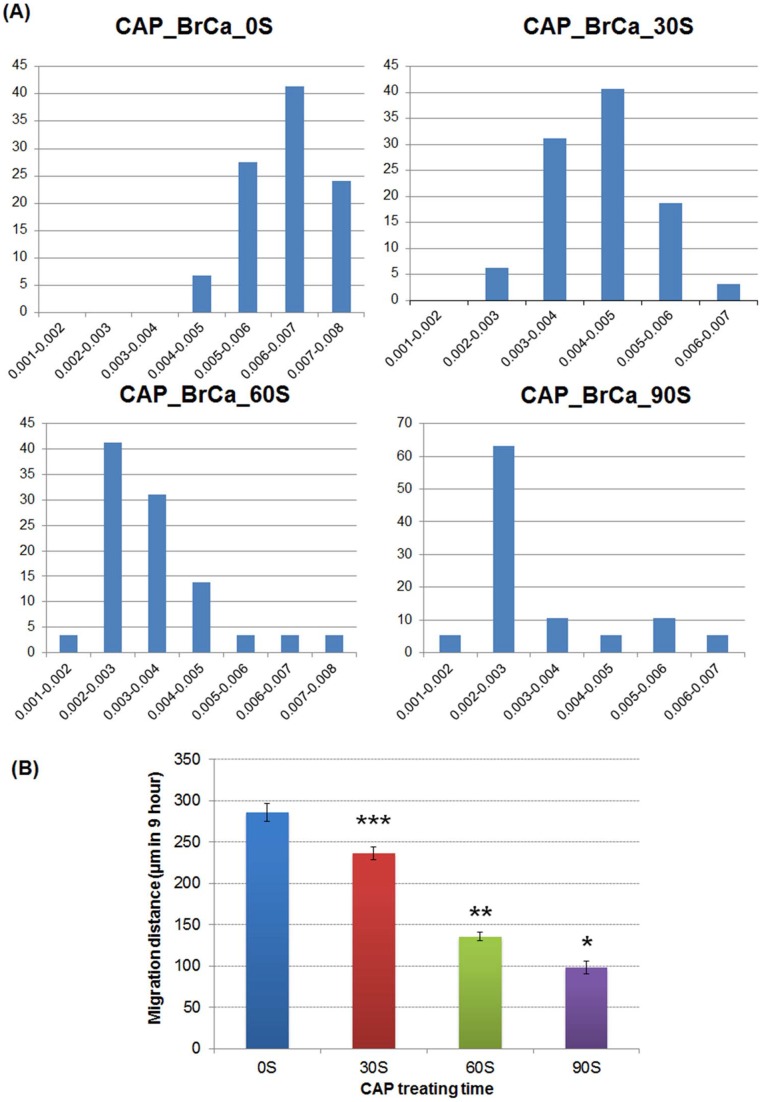
Figure 14. BrCa cell migration velocity after CAP treatment.
(A) Cell velocity distribution of the first line of bottom of scratch for each condition in first 9 hours. X axis represents velocity distribution (µm/second) and Y axis represents cell percentage (%). (B) Quantification of average migration distance of BrCa cells under different CAP treatments in 9 hours. Data are mean ± SEM, n = 9; *p<0.001, **p<0.001 and ***p<0.001 when compared to all other treatments.

