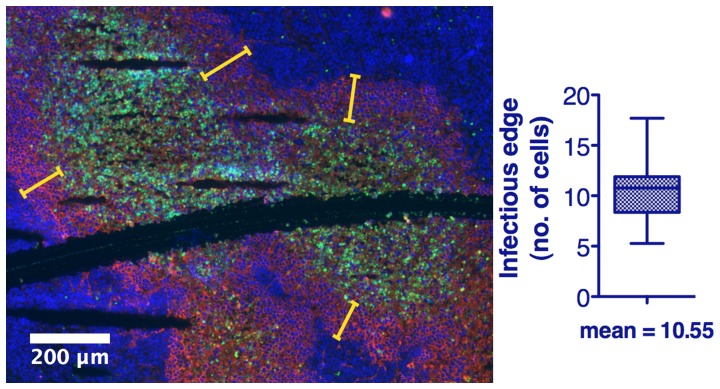
Figure 2. Quantification of viable infected rim at the leading edge of infection to determine cell death rate.
Immunofluorescence analysis of 5TGM1 tumors harvested 48-VSV administration, sectioned and stained to detect VSV (red), dying cells (TUNEL, green) and tumor cell nuclei (Hoescht, blue). Quantification of the mean viable rim width(n = 36 measurements), expressed in terms of cell diameters, at the leading edge of infection allows for the time from cellular infection by the VSV to cell death to be determined. Yellow bars indicate example locations of rim width determination.

