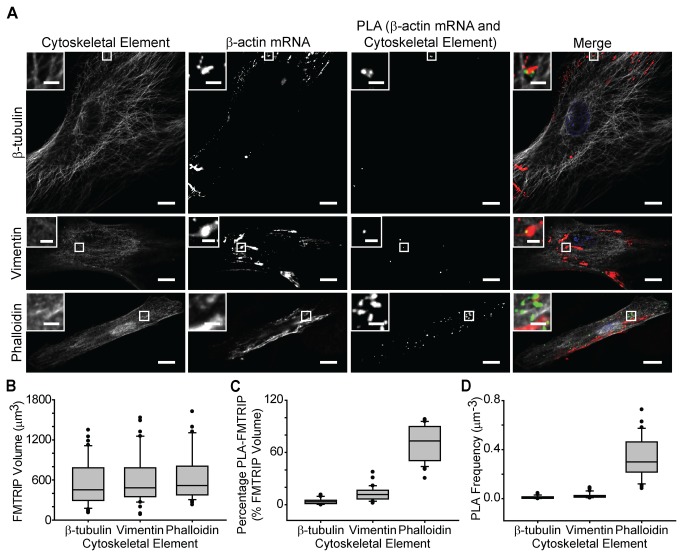
Figure 5. Interactions between β-actin mRNA and cytoskeletal elements in HDF.
(A) β-tubulin, vimentin and phalloidin IF, β-actin mRNA, and PLA between β-actin mRNA and the cytoskeletal elements in HDF were imaged with a laser-scanning confocal microscope. Merged images of the cytoskeleton (white), β-actin mRNA (red), PLA (green), and nuclei (blue) are shown. Single image plane is represented. Inset, images of boxed regions. Scale bar, 10 µm (2 µm in insets). (B) The mean FMTRIP volume was similar (Kruskal-Wallis One Way ANOVA on Ranks, p=0.5) in cells, where the interactions between β-actin mRNA and β-tubulin (n=40, mean=567µm3, s.d.=355µm3), vimentin (n=36, mean=607µm3, s.d.=385µm3), or phalloidin (n=30, mean=660µm3, s.d.=389µm3) were quantified. (C) The mean percentage of FMTRIP colocalized with PLA (PLA-FMTRIP) was significantly different (Table S5) between the interactions of β-actin mRNA with β-tubulin (n=40, mean=3.9%, s.d.=3.2%), vimentin (n=36, mean=12.7%, s.d.=7.9%), or phalloidin (n=30, mean=71.5%, s.d.=20.1%). (D) The mean PLA frequency was significantly different (Table S6) between the interactions of β-actin mRNA with β-tubulin (n=40, mean=0.012µm-3, s.d.=0.011µm-3), vimentin (n=36, mean=0.027µm-3, s.d.=0.023µm-3), or phalloidin (n=30, mean=0.33µm-3, s.d.=0.17µm-3). Error bars, s.d.

