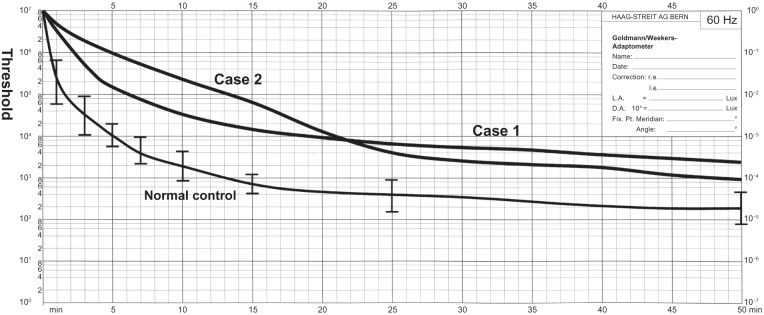
Figure 3.

Results of Goldmann–Weekers dark adaptometry.
Note: The thin line indicates the average ± standard deviation isopter of normal controls.

Results of Goldmann–Weekers dark adaptometry.
Note: The thin line indicates the average ± standard deviation isopter of normal controls.