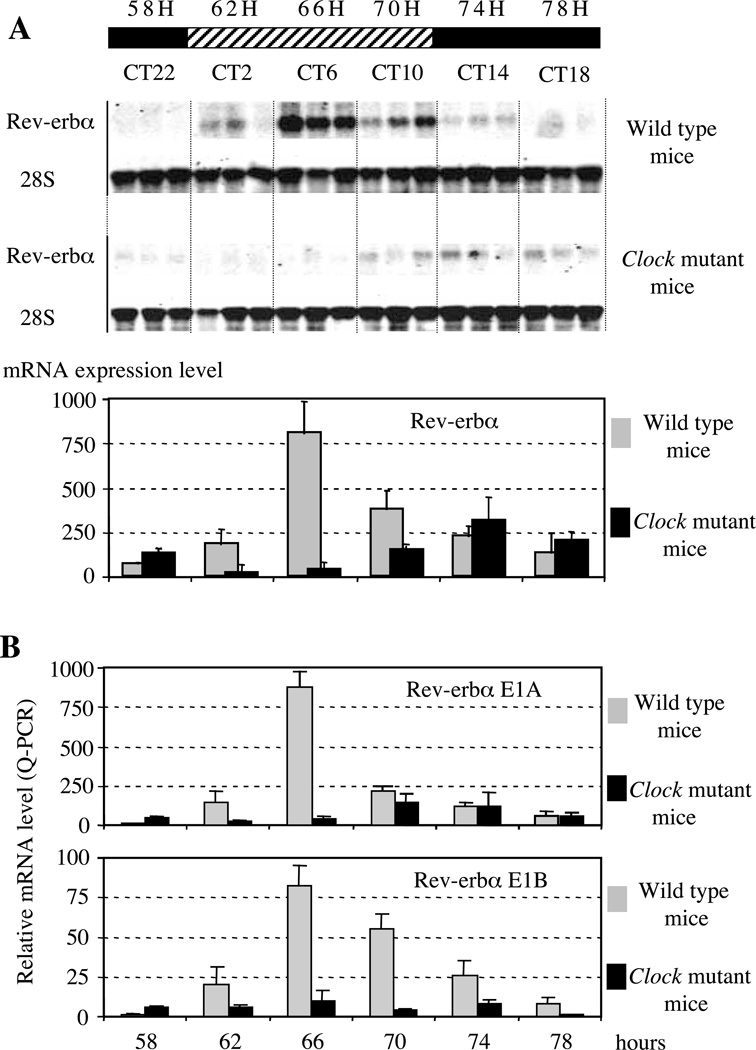
Figure 8.
(A) Northern blot analysis of Rev-erbα expression in Clock mutant mice. (A, B) The scale above the Figure indicates subjective day (hatched) or night (black), respectively. Time is indicated either as the number of hours after constant darkness (above the scale), or circadian time (CT below the scale): CT0 is the time when light would normally be switched on. Each lane was loaded with 10 µg total liver RNA. Animals were maintained in dark/dark conditions and three animals were killed at each indicated time. (A) Membranes were first probed with a Rev-erbα probe (detecting the two isoforms), exposed, washed and rehybridized with 28S probe to normalize the signal. Normalized Rev-erbα expression levels are shown as histograms at the bottom of the Figure. These histograms are the results of two independent Northern blot experiments. (B) Differential analysis of transcripts emanating from transcripts starting from P1 (E1A, upper panel) or P2 (E1B, lower panel) in wild-type or Clock mutant mice by Q-PCR experiments. Note the different scales of the histograms.

